Open Access
Fig. 3.
Download original image
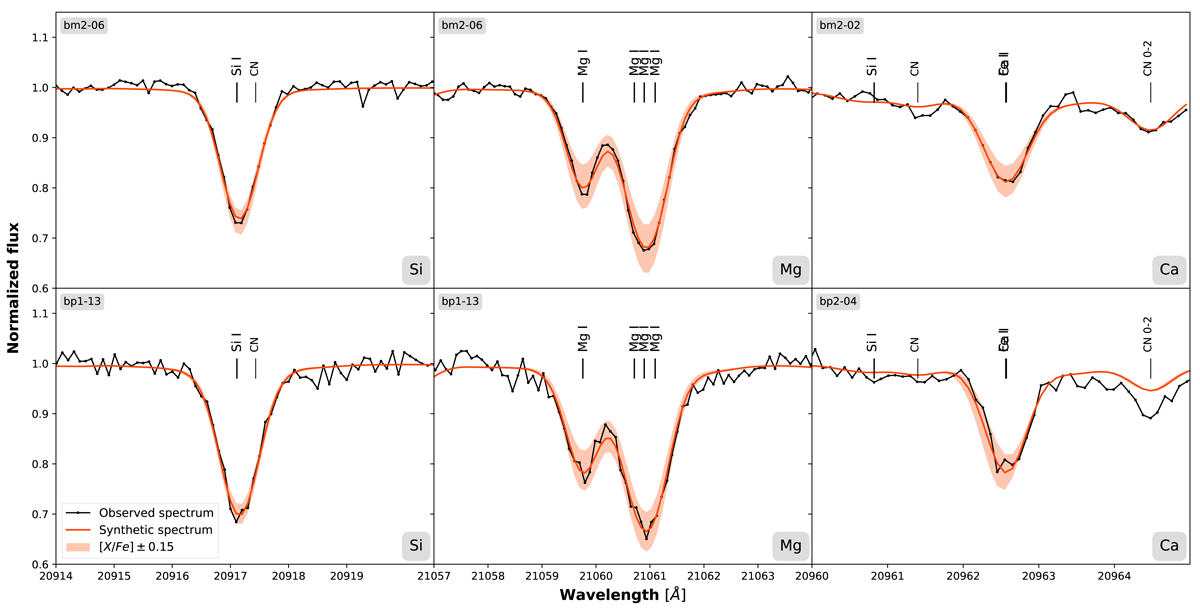
Typical spectral fits for Si, Mg, and Ca lines with a variation band of ±0.15 dex in abundance. The upper panel shows fitted lines for stars with a good S/N whereas the lower panel shows those for stars with a poor S/N.
Current usage metrics show cumulative count of Article Views (full-text article views including HTML views, PDF and ePub downloads, according to the available data) and Abstracts Views on Vision4Press platform.
Data correspond to usage on the plateform after 2015. The current usage metrics is available 48-96 hours after online publication and is updated daily on week days.
Initial download of the metrics may take a while.