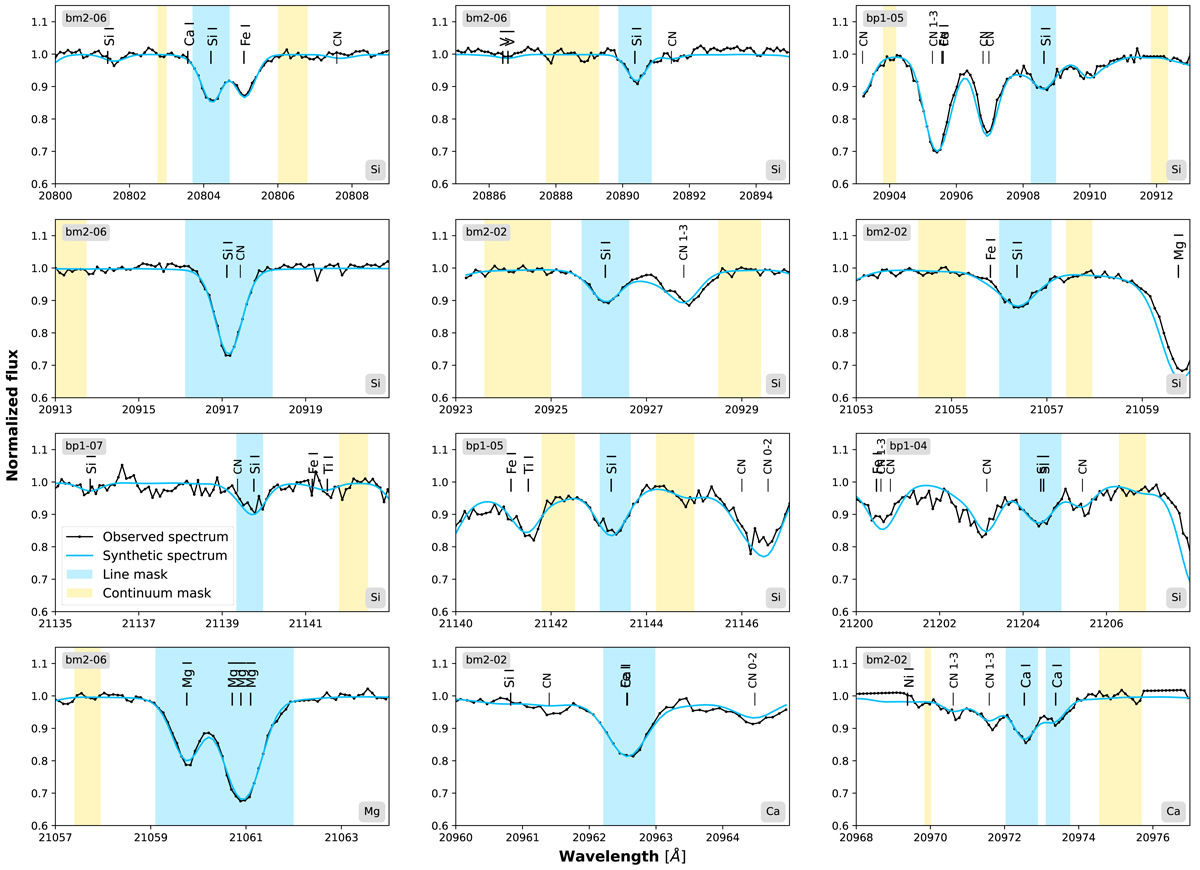
Fig. 2.

Download original image
Typical spectral fits for Si (the nine upper plots), Mg (lower left), and Ca lines (lower middle and right) used in the analysis. The stellar name is given in the upper left corner of every subplot. The black observed data are fitted with the blue synthetic spectrum. The lines of interest are marked with the blue line masks. The yellow masks show the regions in the spectrum that are used to normalise the local continuum around the lines. In some of the plots, these continuum regions are outside of the figure. The linear local continuum is always fitted with at least three continuum windows in every segment close to the line of interest.
Current usage metrics show cumulative count of Article Views (full-text article views including HTML views, PDF and ePub downloads, according to the available data) and Abstracts Views on Vision4Press platform.
Data correspond to usage on the plateform after 2015. The current usage metrics is available 48-96 hours after online publication and is updated daily on week days.
Initial download of the metrics may take a while.


