Fig. A.1
Download original image
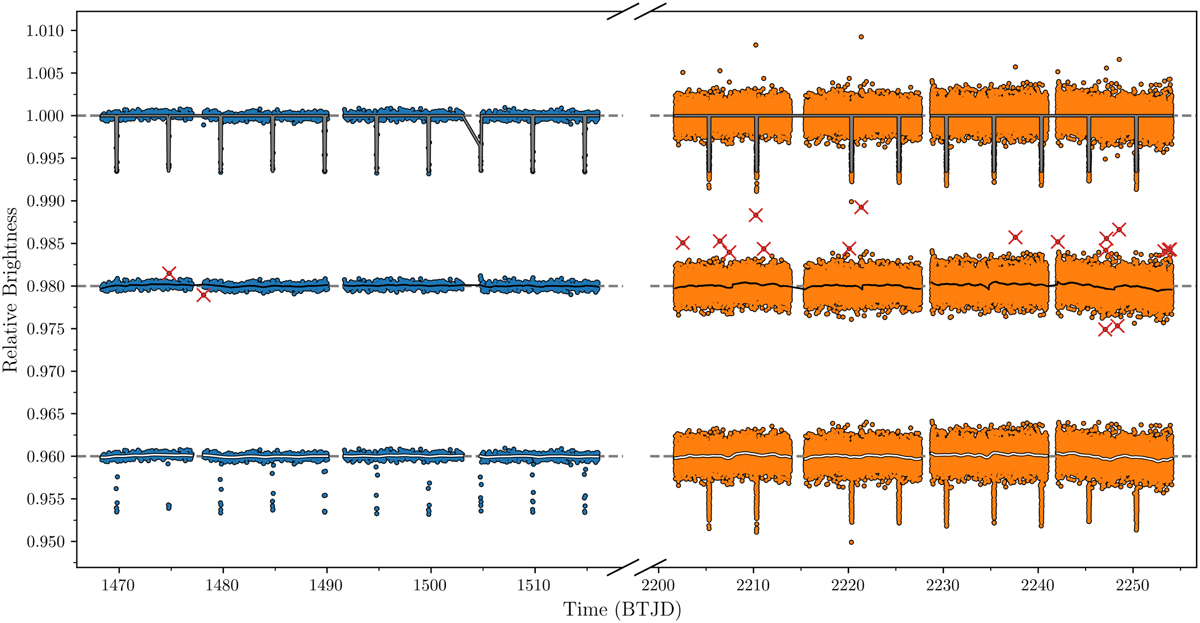
TESS photometry of TOI-640. TESS photometry of TOI-640 with Sectors 6 and 7 is shown in blue to the left and Sectors 33 and 34 in orange to the right. The light curves at the top have been corrected for scattered light. The grey curves show the best-fitting (determined iteratively) transit model. In the middle, we have subtracted this transit model. We used a Savitzky-Golay filter (black curve) to identify outliers, which are marked as red crosses. In the bottom, we have re-injected the transits into the light curves with the outliers removed. The white curves are the GPs we used to de-trend the data during our MCMC fit (see Section 3.1).
Current usage metrics show cumulative count of Article Views (full-text article views including HTML views, PDF and ePub downloads, according to the available data) and Abstracts Views on Vision4Press platform.
Data correspond to usage on the plateform after 2015. The current usage metrics is available 48-96 hours after online publication and is updated daily on week days.
Initial download of the metrics may take a while.