Fig. 5
Download original image
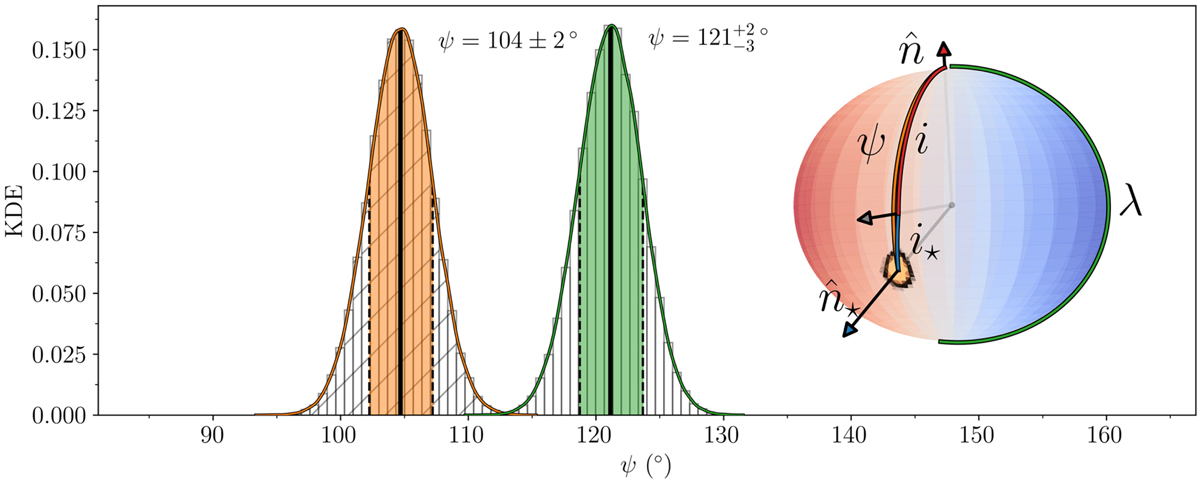
Obliquity distributions. The histograms are the distributions for ψ calculated from the rotation period in Sect. 3.2 with the KDE overplotted as the solid lines. The coloured areas are the confidence intervals with the medians shown as the black lines. The orange distribution corresponds to using the orbital inclination, i, directly from our posteriors and the green is i − 180°. On the sphere, we only show the “orange” distribution for ψ as the heatmap. We do this for a fixed value of i (in terms of how the sphere is oriented). The sphere is colour coded according to the perceived movement of the stellar disk with the approaching (receding) side in blue (red) for an observer along the line of sight, which is denoted by the grey arrow.
Current usage metrics show cumulative count of Article Views (full-text article views including HTML views, PDF and ePub downloads, according to the available data) and Abstracts Views on Vision4Press platform.
Data correspond to usage on the plateform after 2015. The current usage metrics is available 48-96 hours after online publication and is updated daily on week days.
Initial download of the metrics may take a while.