Fig. 2
Download original image
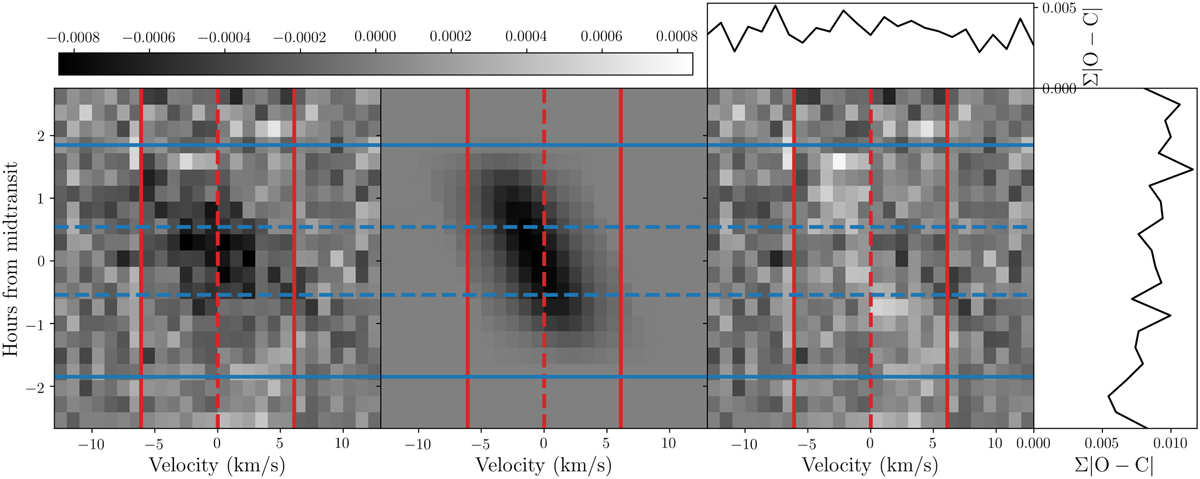
Planetary shadow. Left: distortion of the stellar absorption lines as seen for our observations with HARPS taken on the transit night. The vertical solid lines denote ±v sin i⋆, and the vertical dashed line is at v = 0 km s−1. The horizontal dashed lines mark the points of second and third contact, which is when the planet is found completely within the stellar disk, and the solid lines denote the first and fourth contact points, where the planetary and stellar disk start to overlap. Middle: best-fitting model of the distortion. Right: residuals from subtracting the best-fitting model from the data. The horizontal bar on top shows the strength of the signal.
Current usage metrics show cumulative count of Article Views (full-text article views including HTML views, PDF and ePub downloads, according to the available data) and Abstracts Views on Vision4Press platform.
Data correspond to usage on the plateform after 2015. The current usage metrics is available 48-96 hours after online publication and is updated daily on week days.
Initial download of the metrics may take a while.