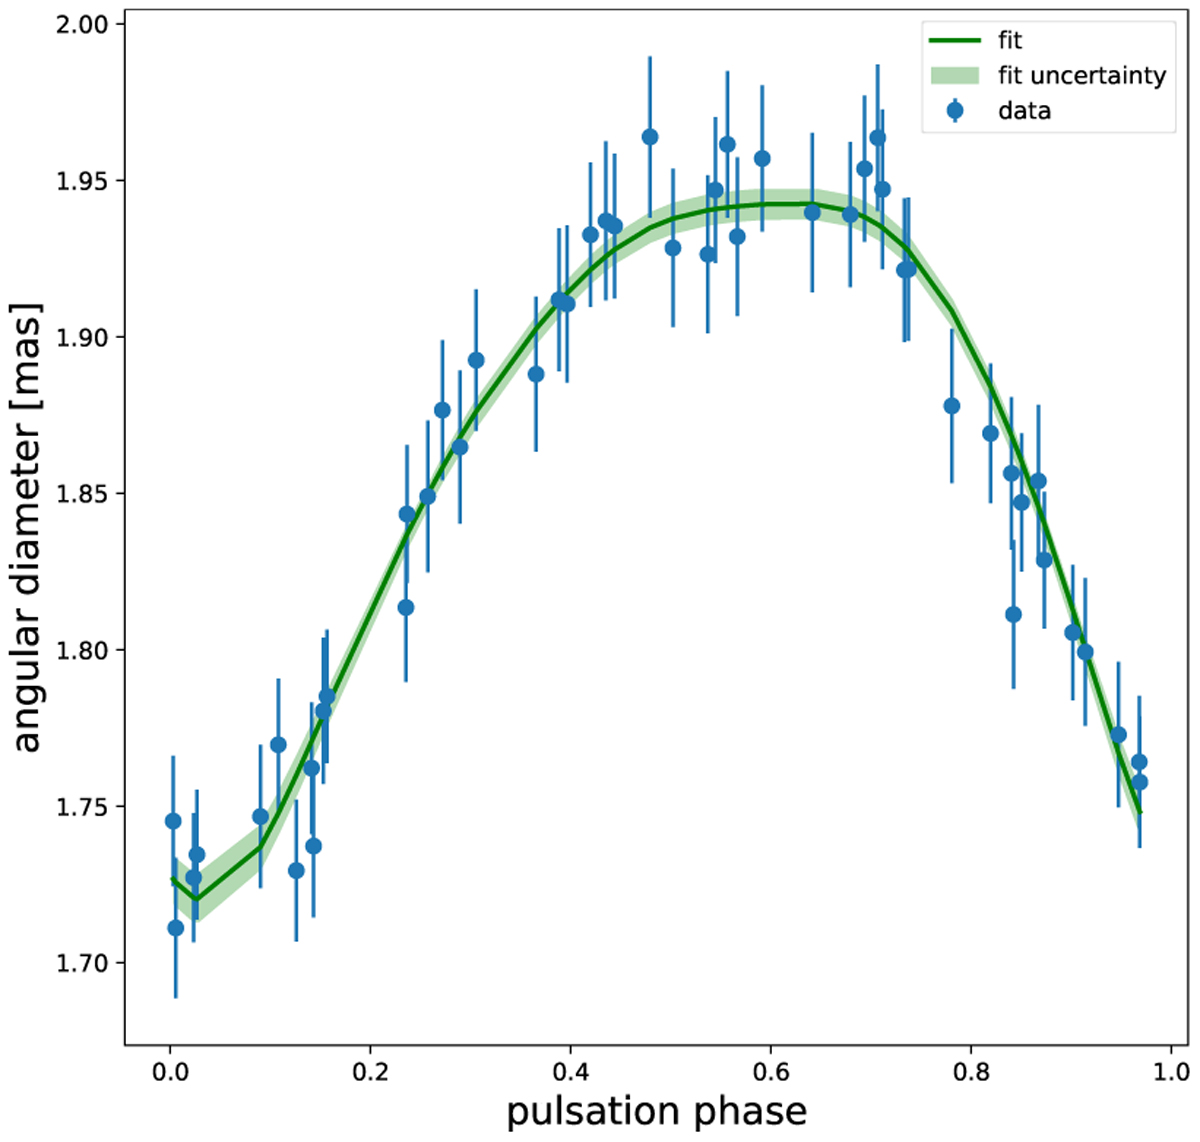
Fig. 9
Download original image
Example of the fit when the inverse BW method was applied, using the K04 SBCR together with the V- and K-band photometry of Fig. 5. The derived angular diameters are plotted as a function of the pulsation phase together with the uncertainties propagated from the uncertainties on the V and K photometries. The best fit is indicated by the green line.
Current usage metrics show cumulative count of Article Views (full-text article views including HTML views, PDF and ePub downloads, according to the available data) and Abstracts Views on Vision4Press platform.
Data correspond to usage on the plateform after 2015. The current usage metrics is available 48-96 hours after online publication and is updated daily on week days.
Initial download of the metrics may take a while.