Fig. 8
Download original image
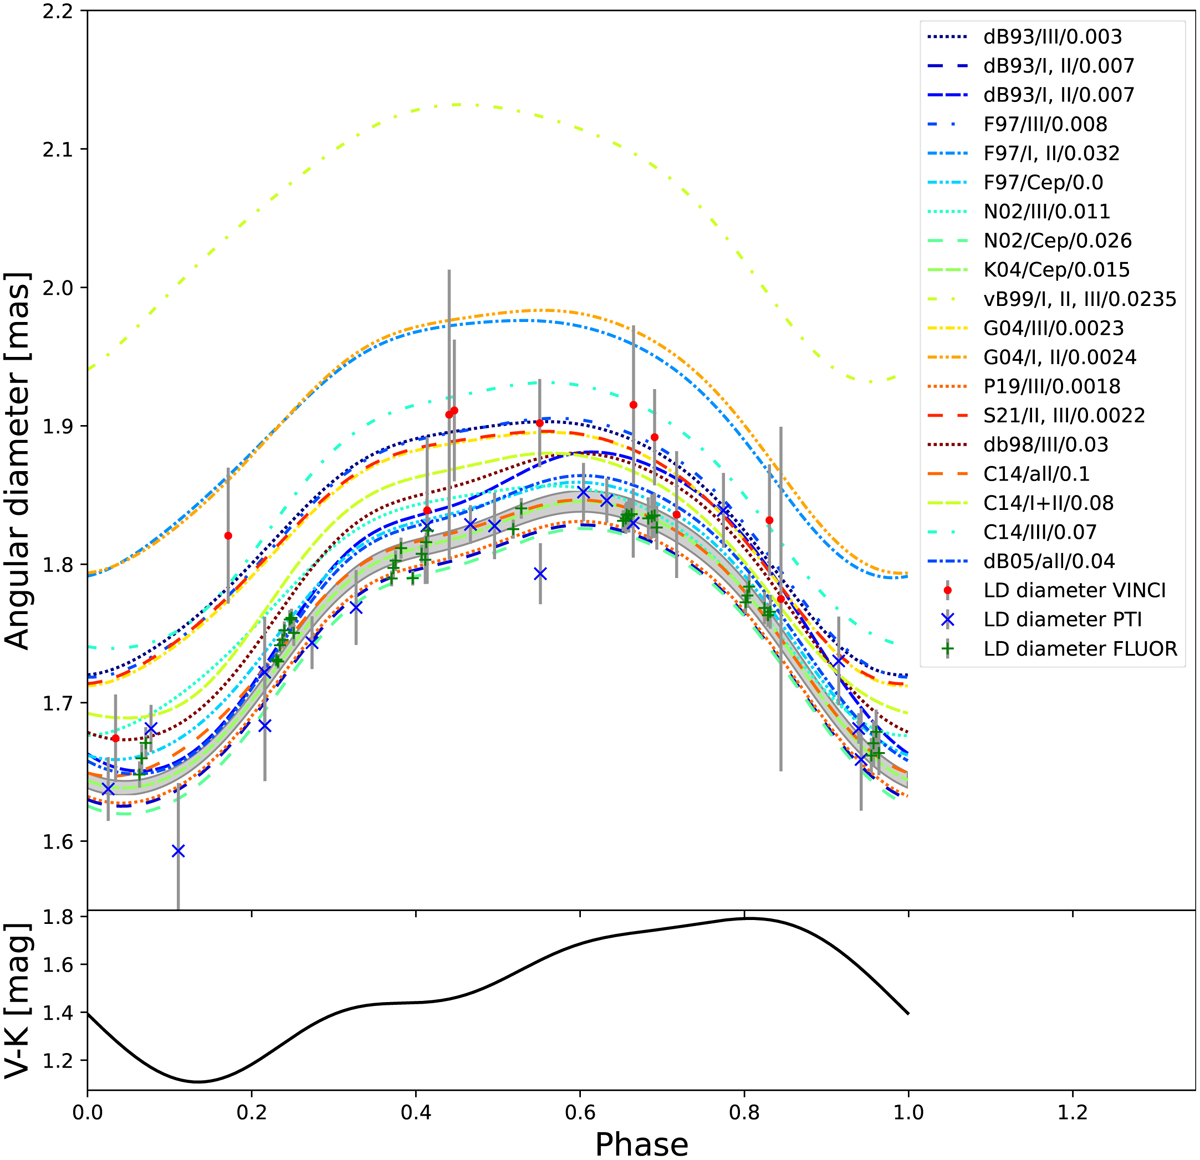
Angular diameter curves as derived from SBCRs. Top: angular diameter of η Aql as a function of the pulsation phase for different SBCRs (from Fig. 6) combined with the V and K light curves (Fig. 5). The gray band corresponds to the uncertainty on the angular diameters caused by the uncertainty of the coefficients of the K04 SBCR. For comparison, we also plot the limb-darkened angular diameter as obtained by VINCI, PTI, and FLUOR measurements. Bottow: V − K color of η Aql.
Current usage metrics show cumulative count of Article Views (full-text article views including HTML views, PDF and ePub downloads, according to the available data) and Abstracts Views on Vision4Press platform.
Data correspond to usage on the plateform after 2015. The current usage metrics is available 48-96 hours after online publication and is updated daily on week days.
Initial download of the metrics may take a while.