Open Access
Fig. 5
Download original image
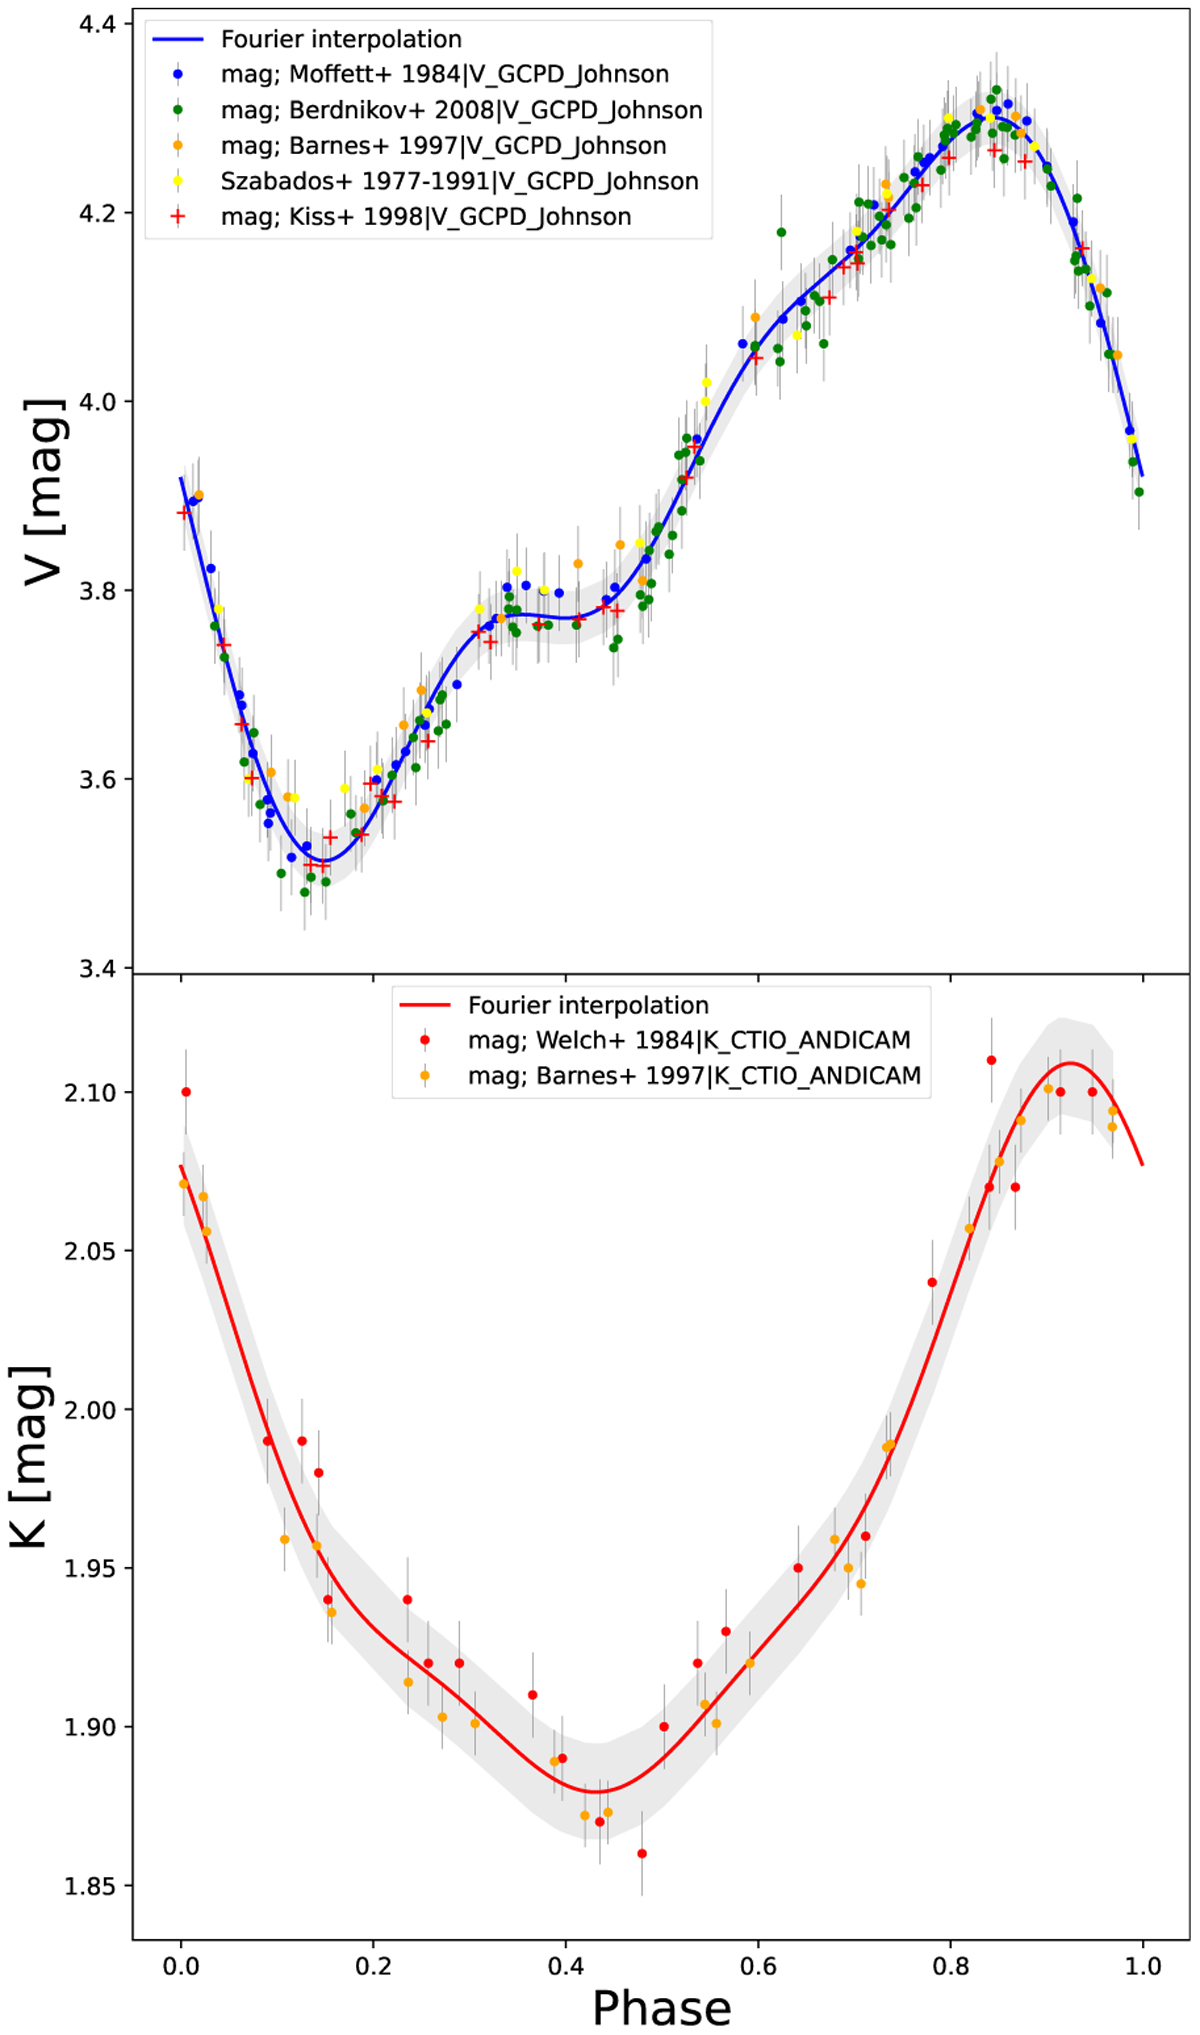
Photometric curves of η Aql. Top: V-band photometric measurements from the literature plotted against the pulsation phase. The solid blue line is an interpolation using a Fourier series. Bottom: same as in the top panel, but in the K-band. The gray zones correspond to the uncertainty in the fit.
Current usage metrics show cumulative count of Article Views (full-text article views including HTML views, PDF and ePub downloads, according to the available data) and Abstracts Views on Vision4Press platform.
Data correspond to usage on the plateform after 2015. The current usage metrics is available 48-96 hours after online publication and is updated daily on week days.
Initial download of the metrics may take a while.