Fig. 4
Download original image
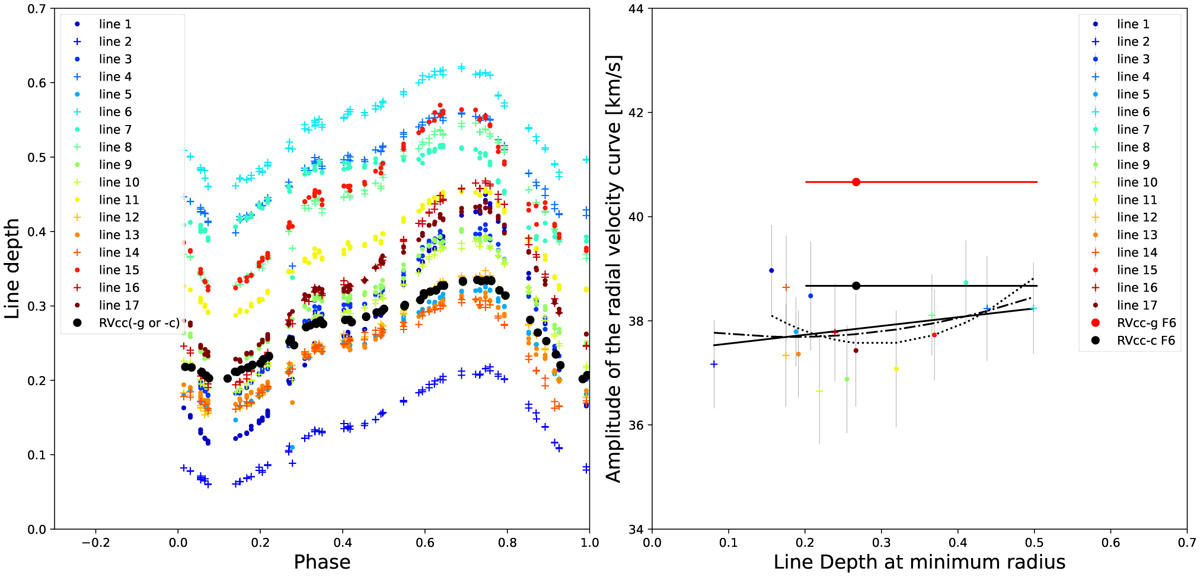
Measure of the atmospheric velocity gradient of η Aql. Left: depth for the 17 spectral lines as a function of the pulsation phase, as well as the depth of the cross-correlated profile (black dots). The quantity corresponding to the line depth is slightly different for the Gaussian fit (RVcc−g) method or the centroid (RVcc−c), but it provides the same values. Right: amplitude of the radial velocity curves of the 17 spectral lines listed in Table 1, plotted vs. the line depth, at minimum radius. The amplitudes for the RVcc−g and RVcc−c curves (template F6) are shown for comparison (red and black dots, respectively) together with the minimum and maximum depth of the cross-correlated profile (horizontal red and black lines). Different fits are processed (see the text for the explanation).
Current usage metrics show cumulative count of Article Views (full-text article views including HTML views, PDF and ePub downloads, according to the available data) and Abstracts Views on Vision4Press platform.
Data correspond to usage on the plateform after 2015. The current usage metrics is available 48-96 hours after online publication and is updated daily on week days.
Initial download of the metrics may take a while.