Fig. 6.
Download original image
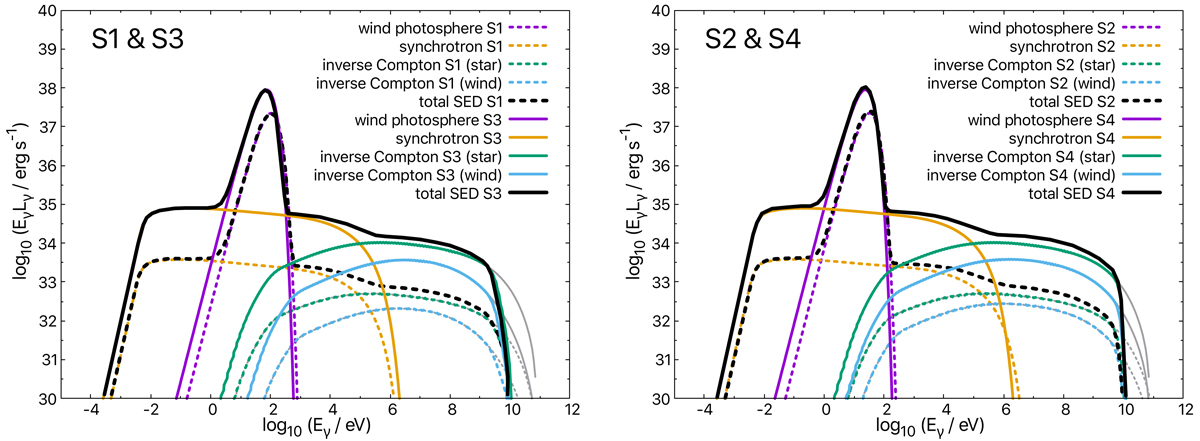
Thermal and nonthermal SEDs of the four scenarios considered, S1–S4, in logarithmic scale, where a face-on inclination is assumed. S1 and S3 are shown in the left plot, whereas S2 and S4 are shown in the right plot. Dashed lines correspond to S1 (left) and S2 (right), solid lines correspond to S3 (left) and S4 (right). We plot the nonattenuated inverse Compton contributions in gray. The emission peak at high energies is ∼1033 erg s−1 for S1 and S2, and ∼1034 erg s−1 for S3 and S4. The gamma-ray absorption due to γγ annihilation is total for energies > 10 GeV.
Current usage metrics show cumulative count of Article Views (full-text article views including HTML views, PDF and ePub downloads, according to the available data) and Abstracts Views on Vision4Press platform.
Data correspond to usage on the plateform after 2015. The current usage metrics is available 48-96 hours after online publication and is updated daily on week days.
Initial download of the metrics may take a while.