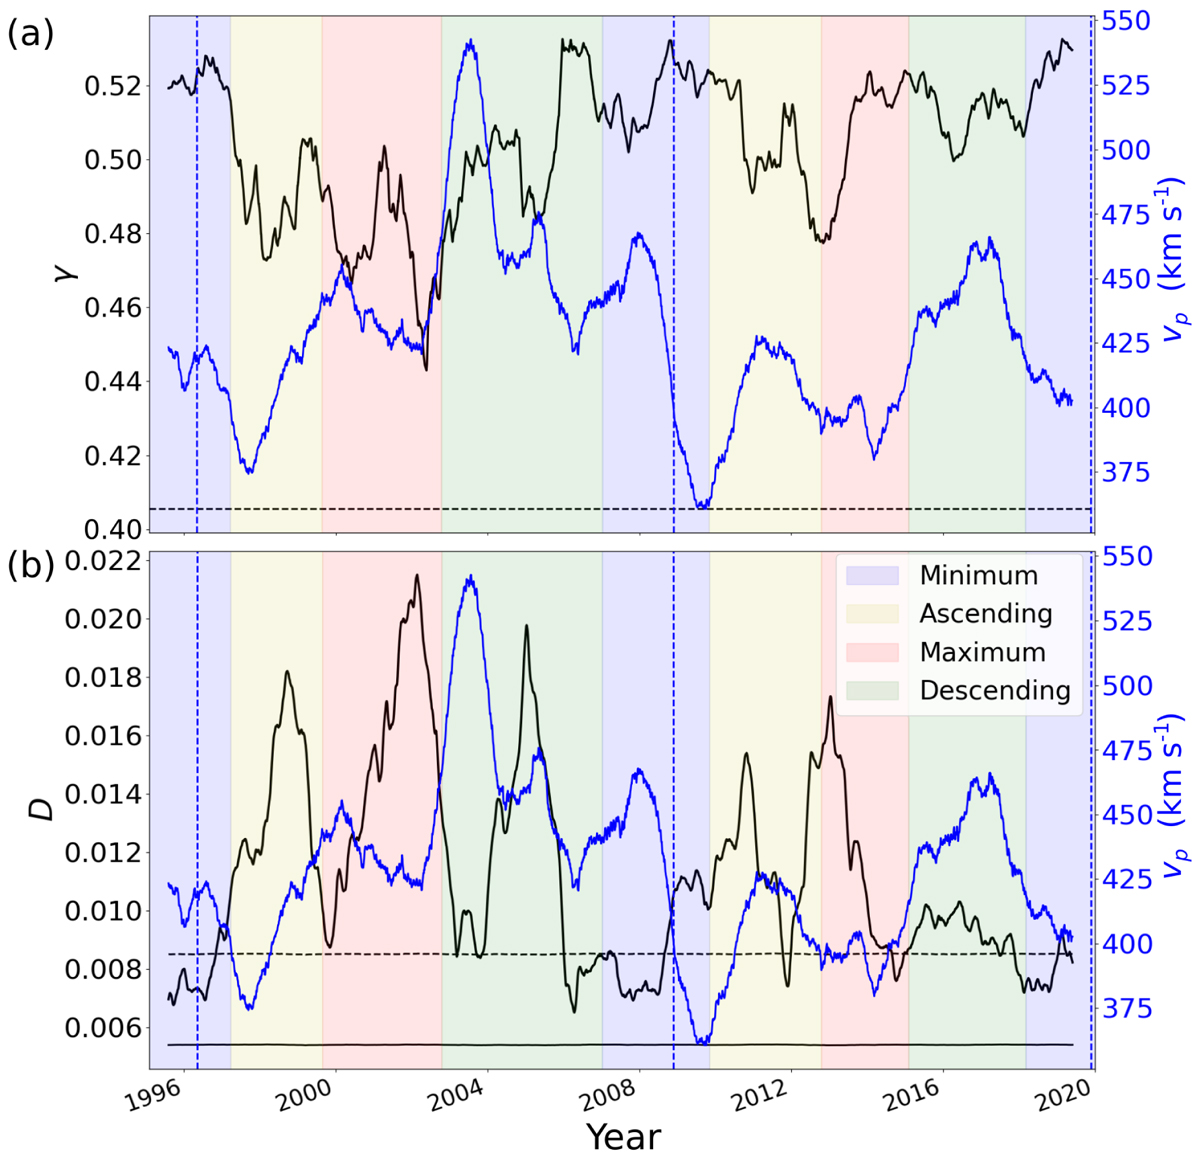
Fig. 5.
Download original image
Relations between solar wind speed and complexity parameters: All curves are smoothed by a yearly running average of the values of γ and D (black curves) on the left and vp (blue curves) on the right. Horizontal dashed black lines indicate the limit γun between chaotic and stochastic information in (a) and the upper half of the reversibility range over the continuous black line in (b). Vertical dashed blue lines delimit solar cycles 23 and 24. The colored blocks represent the phases of the solar cycles. The time period covers from 5 Aug. 1995 to 29 May 2019.
Current usage metrics show cumulative count of Article Views (full-text article views including HTML views, PDF and ePub downloads, according to the available data) and Abstracts Views on Vision4Press platform.
Data correspond to usage on the plateform after 2015. The current usage metrics is available 48-96 hours after online publication and is updated daily on week days.
Initial download of the metrics may take a while.