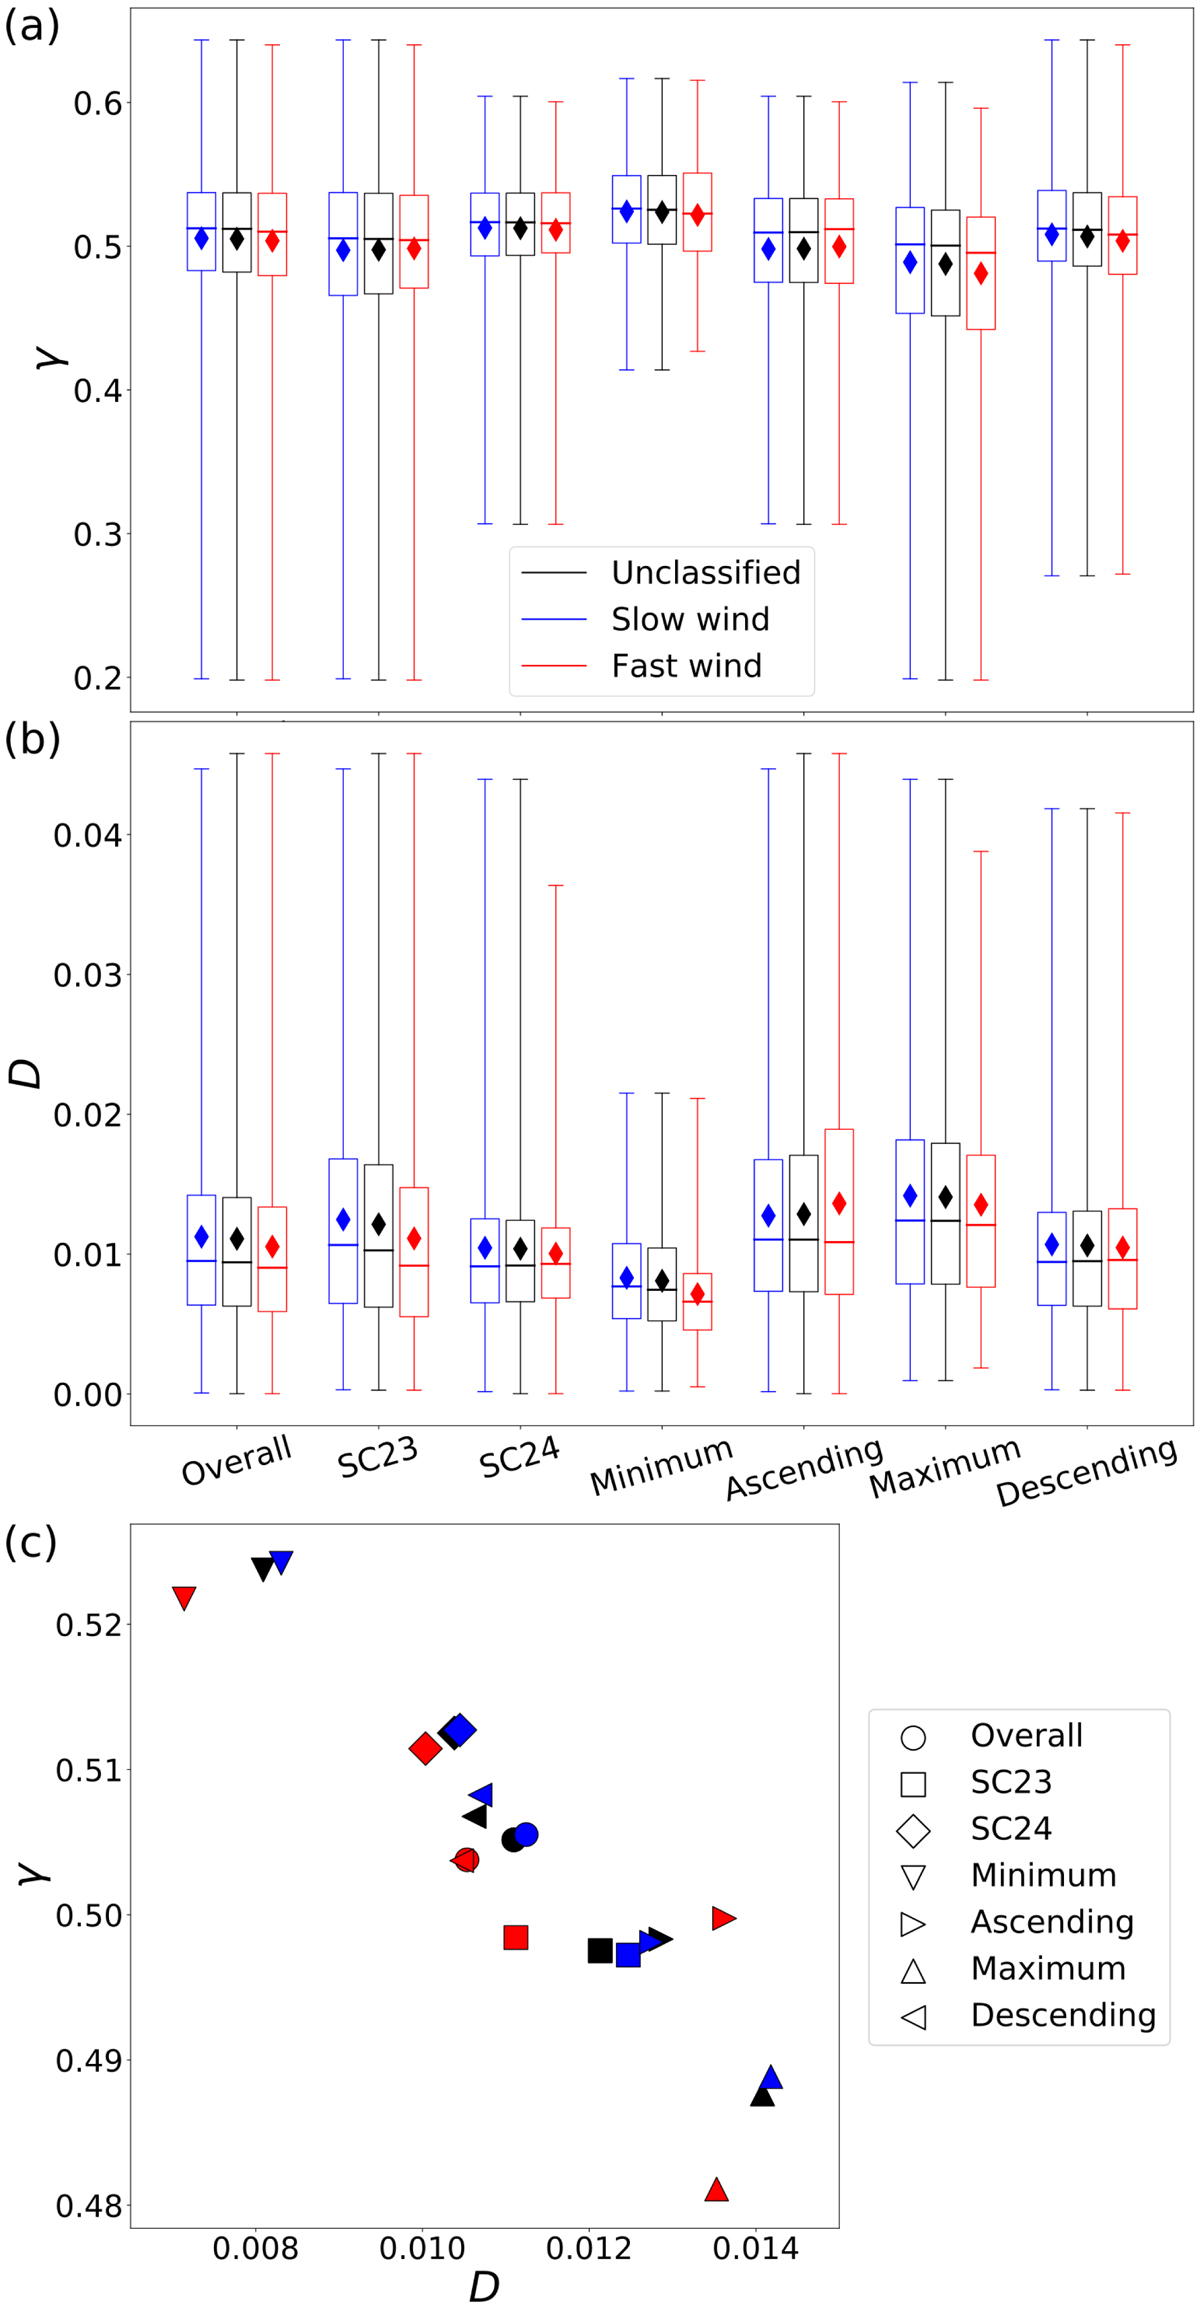
Fig. 3.
Download original image
Solar wind: boxplot diagrams in the first two panels show the mean (diamond symbol), median (horizontal line), and 25%–75% percentiles of (a) γ and (b) D values for overall data by cycle, and by total cycle-independent phases, according to the following classification: slow and fast for speeds under and over 500 km s−1, respectively. The whisker indicates the range between minimum and maximum values calculated. (c) Scatter plot between the mean values of γ and D for solar wind without classifying (black), slow wind (blue), and fast wind (red).
Current usage metrics show cumulative count of Article Views (full-text article views including HTML views, PDF and ePub downloads, according to the available data) and Abstracts Views on Vision4Press platform.
Data correspond to usage on the plateform after 2015. The current usage metrics is available 48-96 hours after online publication and is updated daily on week days.
Initial download of the metrics may take a while.