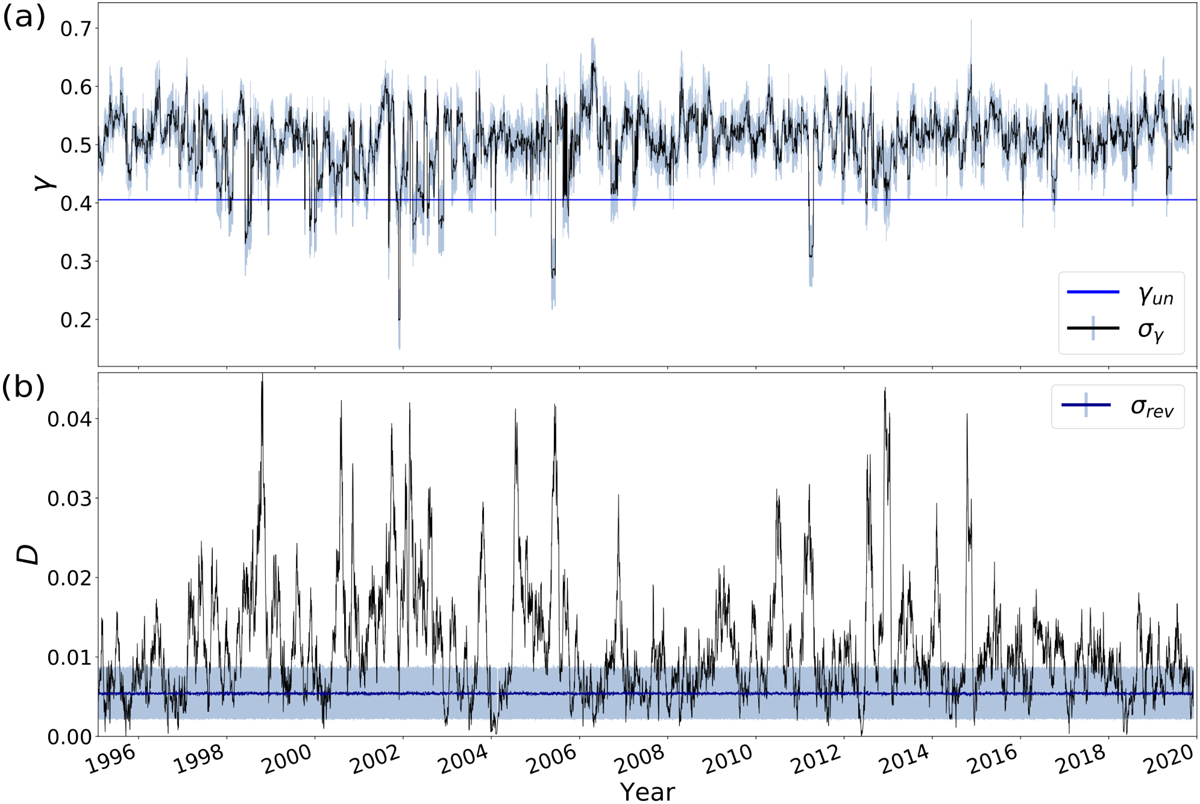
Fig. 2.
Download original image
Temporal evolution of the (a) γ and (b) D of the magnetic field from 31 Jan. 1995 to 2 Dec. 2019, considering a moving window that covers two months with a one-day resolution (black solid curves). (a) In the top panel, light blue is used to indicate the γ error, σγ, obtained from the linear fit of log(P(k)). (b) In the bottom panel, light blue is used to indicate the reversibility range. The reversibility range results from the application of the HVG algorithm to randomly disordered copies of the data in every window, obtaining the standard deviation σrev around the average divergence (in dark blue) computed using the disordered data.
Current usage metrics show cumulative count of Article Views (full-text article views including HTML views, PDF and ePub downloads, according to the available data) and Abstracts Views on Vision4Press platform.
Data correspond to usage on the plateform after 2015. The current usage metrics is available 48-96 hours after online publication and is updated daily on week days.
Initial download of the metrics may take a while.