Fig. 5
Download original image
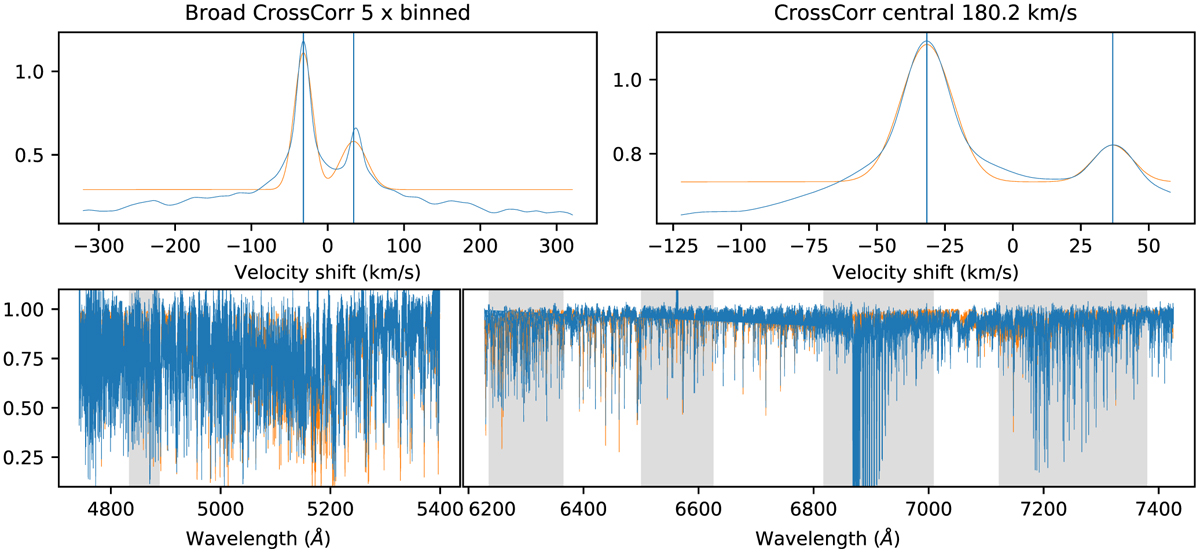
Radial velocities from PEPSI spectra. Shown is the CCF (top panels) and the wavelength coverage for one target for one visit (bottom panels). The target is the double-lined spectroscopic binary BY Dra. Panels show the full CCF with pixels binned by a factor five (top left, blue line) and the unbinned central 180 km s−1 of the CCF (top right, blue line), both along with its Gaussian fit (orange line). The bottom panels are overplots of the observed (blue) and the synthetic spectrum (orange) for CD III (left) and CD V (right). The wavelength zones excluded from the CCF are shaded in grey.
Current usage metrics show cumulative count of Article Views (full-text article views including HTML views, PDF and ePub downloads, according to the available data) and Abstracts Views on Vision4Press platform.
Data correspond to usage on the plateform after 2015. The current usage metrics is available 48-96 hours after online publication and is updated daily on week days.
Initial download of the metrics may take a while.