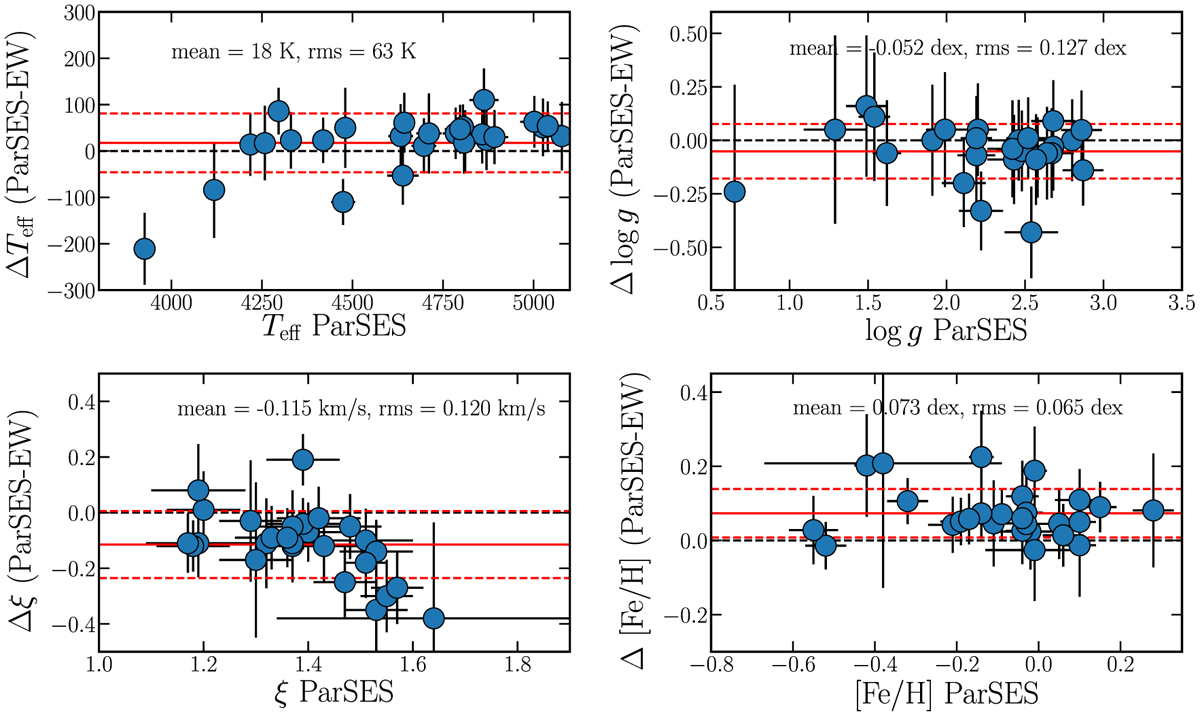
Fig. C.1
Download original image
Comparison of results from the ParSES spectrum synthesis and the EW method (EW) for the STELLA+SES giant-star pilot sample. The four panels show, from top left to bottom right, effective temperature (Teff), logarithmic gravity (log g), microturbulence (ξ), and logarithmic metallicity ([Fe/H]). The respective thick red line in each panel represents the mean difference and its ±1σ values (dashed red lines) also given numerically in the top of each panel. The black dashed line is the zero difference line. The dots are the individual target results with their ± 1σ error bars. See text for details.
Current usage metrics show cumulative count of Article Views (full-text article views including HTML views, PDF and ePub downloads, according to the available data) and Abstracts Views on Vision4Press platform.
Data correspond to usage on the plateform after 2015. The current usage metrics is available 48-96 hours after online publication and is updated daily on week days.
Initial download of the metrics may take a while.