Open Access
Fig. 14
Download original image
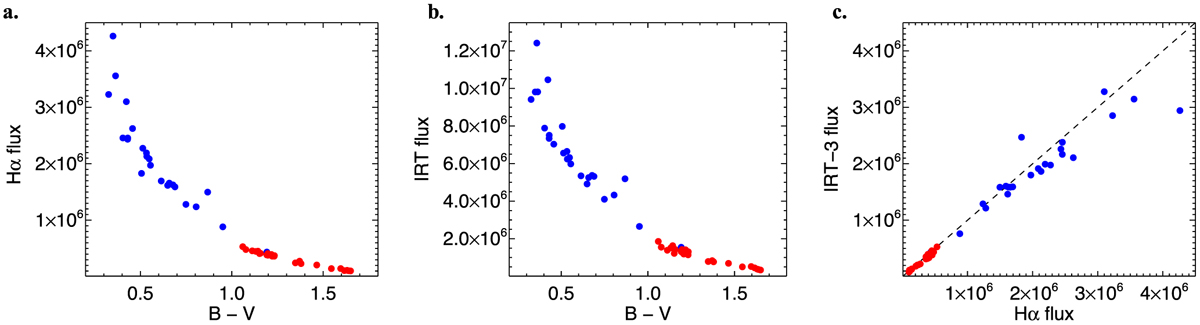
Absolute emission line surface fluxes for the pilot sample. Panel a: Balmer Ha line-core flux vs. B – V. Panel b: summed Ca II IRT line-core flux vs. B – V. Panel c: flux–flux relation for Balmer Hα vs. Call IRT-3. Dashed line is the 1:1 relation. Red dots are from STELLA+SES spectra, blue dots from VATT+PEPSI spectra.
Current usage metrics show cumulative count of Article Views (full-text article views including HTML views, PDF and ePub downloads, according to the available data) and Abstracts Views on Vision4Press platform.
Data correspond to usage on the plateform after 2015. The current usage metrics is available 48-96 hours after online publication and is updated daily on week days.
Initial download of the metrics may take a while.