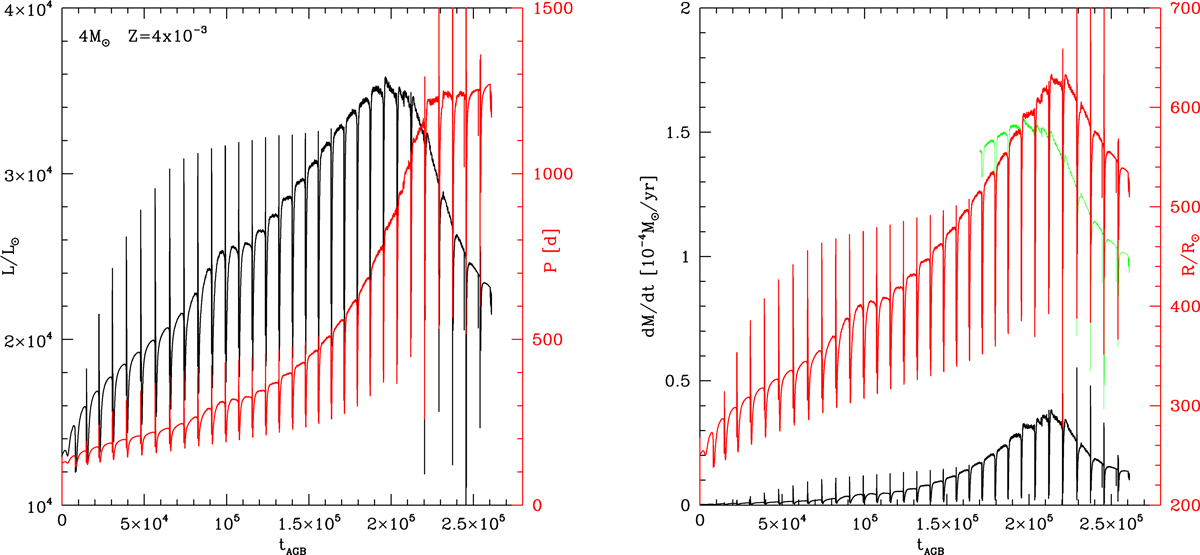
Fig. 6.
Download original image
Evolution of a 4 M⊙ model star of metallicity Z = 4 × 10⁻³, in terms of the time variation of some physical quantities. Mass loss is modeled according to Blöcker & Schöenberner (1991). Times on the x-axis are zeroed at the beginning of the AGB phase. The left panel shows the variation of luminosity (black line, scale left y-axis) and pulsation period (red, scale on the right). The right panel shows the evolution of the mass-loss rate (black line) and of the stellar radius (red, scale on the right). The green line on the right panel shows the mass-loss rate that would be obtained during the super wind phase if the Vassiliadis & Wood (1993) prescription for mass loss was adopted.
Current usage metrics show cumulative count of Article Views (full-text article views including HTML views, PDF and ePub downloads, according to the available data) and Abstracts Views on Vision4Press platform.
Data correspond to usage on the plateform after 2015. The current usage metrics is available 48-96 hours after online publication and is updated daily on week days.
Initial download of the metrics may take a while.