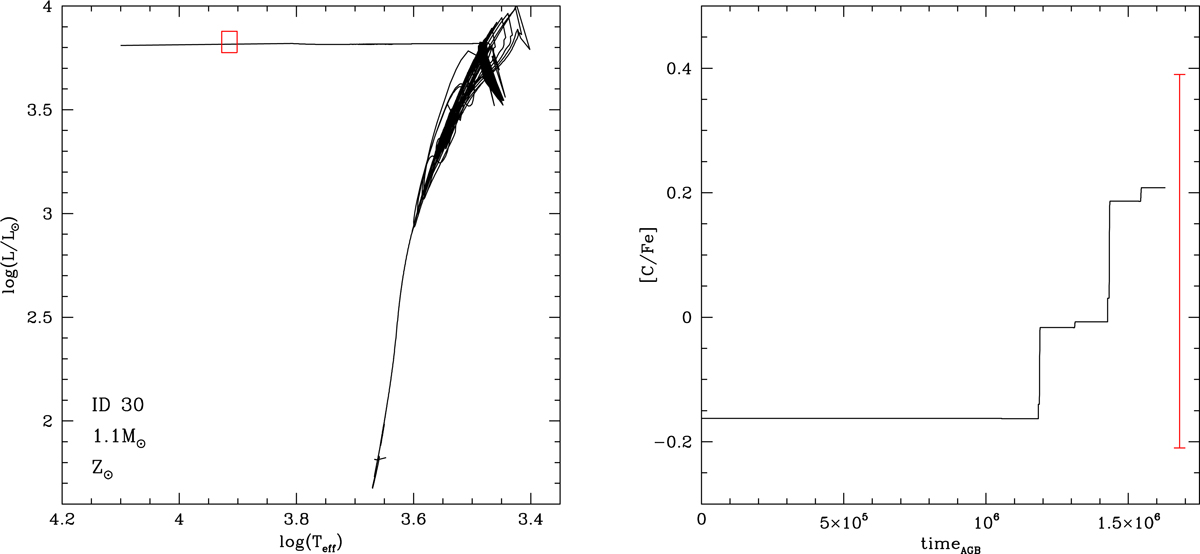
Fig. 5.
Download original image
Excursion of the evolutionary track of a 1.1 M⊙ star of solar metallicity (left panel) and the variation of the surface carbon of the same 1.1 M⊙ model star during the AGB phase. The red box on the left panel indicates the effective temperature and luminosity (with the corresponding error bars) given for ID 30 in Kamath et al. (2022), whereas the red vertical line in the right panel indicates the surface [C/Fe] of ID 30.
Current usage metrics show cumulative count of Article Views (full-text article views including HTML views, PDF and ePub downloads, according to the available data) and Abstracts Views on Vision4Press platform.
Data correspond to usage on the plateform after 2015. The current usage metrics is available 48-96 hours after online publication and is updated daily on week days.
Initial download of the metrics may take a while.