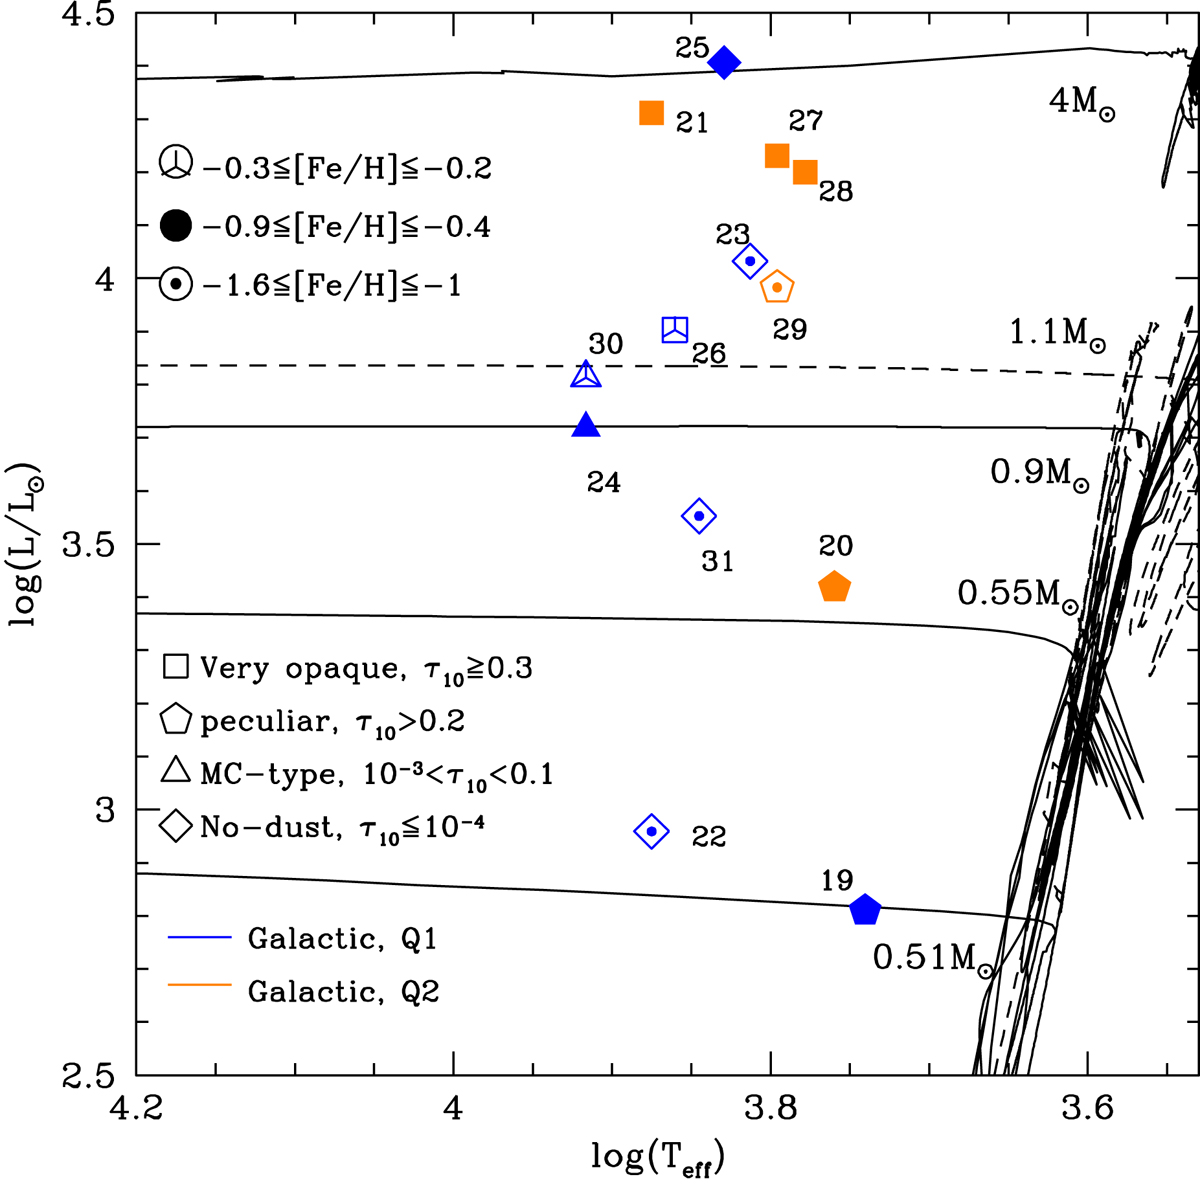
Fig. 3.
Download original image
Distribution of the oxygen-rich post-AGB stars studied here on the H-R diagram, according to the data reported in Table 1. The evolutionary tracks used for the interpretation of the individual objects are also shown, including the late AGB and the post-AGB phase; the tracks considered here have a metallicity of Z = 0.004 (solid lines) and Z = Z⊙ (dashed line), and their mass at the beginning of the AGB phase is reported on the right side.
Current usage metrics show cumulative count of Article Views (full-text article views including HTML views, PDF and ePub downloads, according to the available data) and Abstracts Views on Vision4Press platform.
Data correspond to usage on the plateform after 2015. The current usage metrics is available 48-96 hours after online publication and is updated daily on week days.
Initial download of the metrics may take a while.