Fig. 28
Download original image
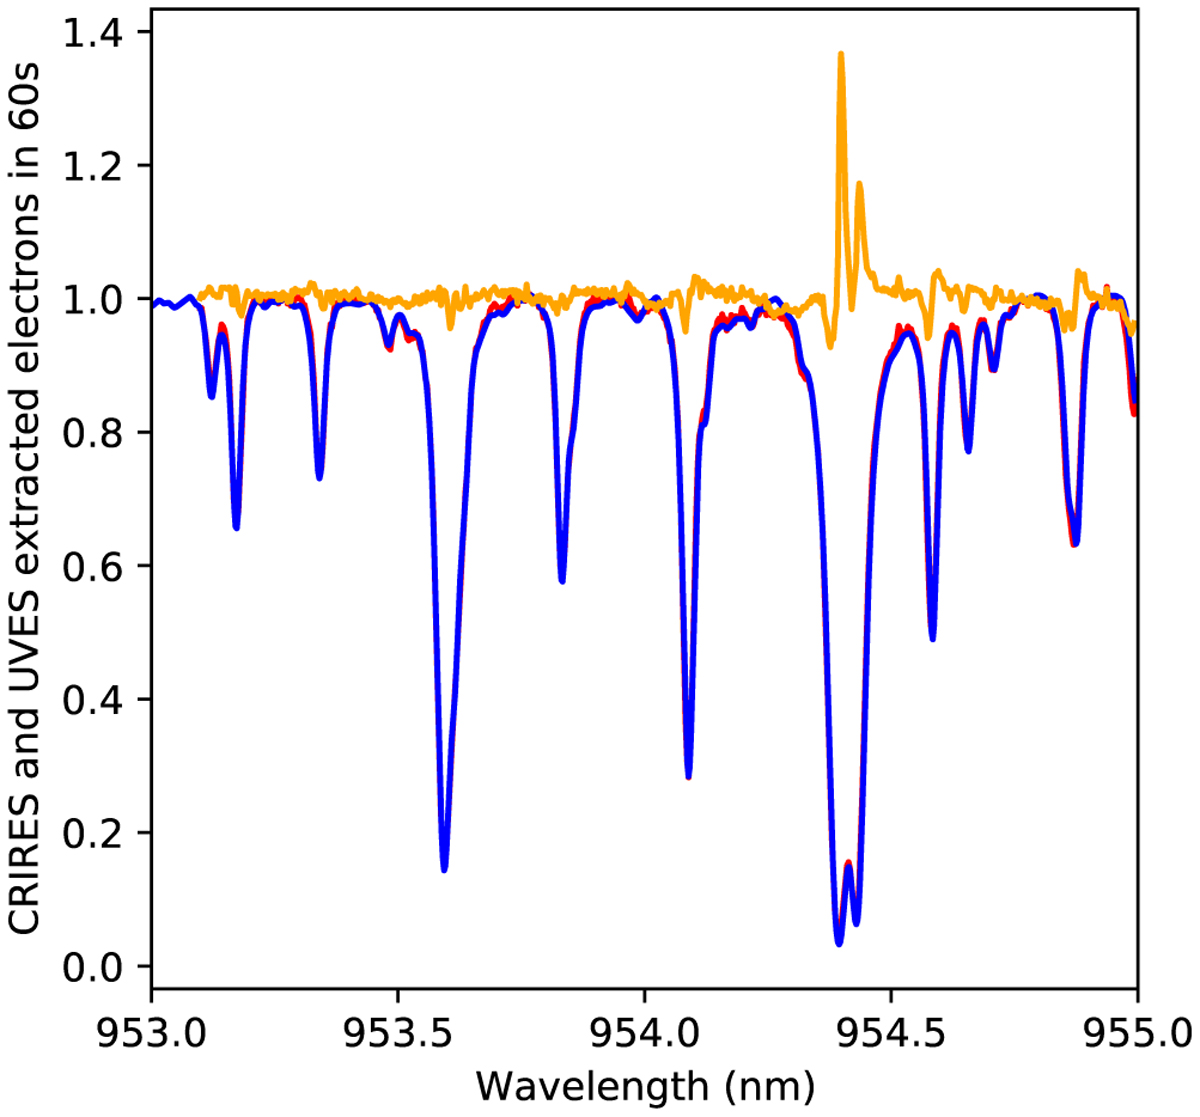
CRIRES+ on UT3 (red) and UVES on UT2 (blue) normalised reduced spectra towards HD 33793, taken simultaneously with 60 s exposure time using a 0.4″ slit. The UVES spectra have been smoothed to match the CRIRES+ observations. The orange line shows the UVES spectrum divided by the CRIRES one. The CRIRES data were reduced using calibrations taken eight months after the observations with a 0.2″ slit and are shifted in wavelength to match the UVES observations. The UVES pipeline resamples the reduced spectra.
Current usage metrics show cumulative count of Article Views (full-text article views including HTML views, PDF and ePub downloads, according to the available data) and Abstracts Views on Vision4Press platform.
Data correspond to usage on the plateform after 2015. The current usage metrics is available 48-96 hours after online publication and is updated daily on week days.
Initial download of the metrics may take a while.