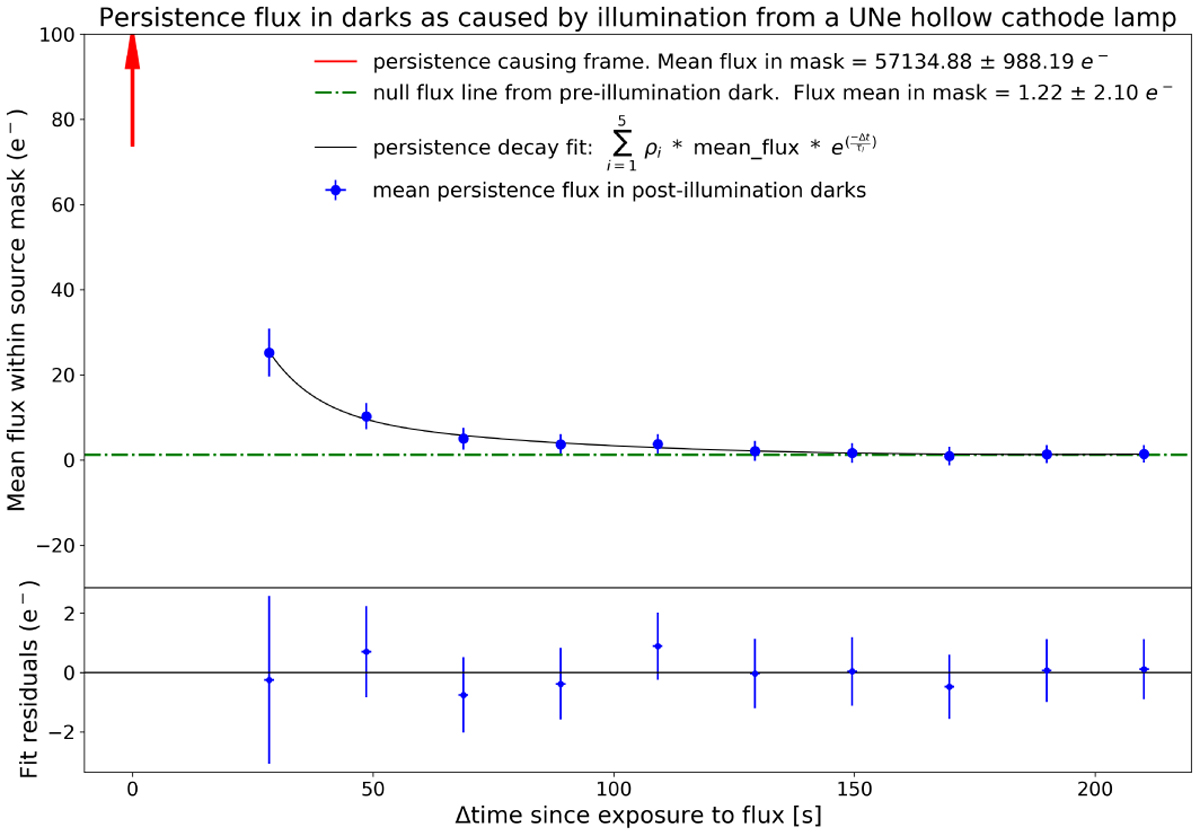
Fig. 16
Download original image
Persistence decay as a function of time since exposure to emission line flux for detector one. Following an exposure with the Uranium Neon hollow cathode calibration lamp, in which the brightest spectral line reached almost 60 k electrons (indicated by the red arrow), we mapped the persistence in a series of ten, post-illumination darks (blue points). Plotting the brightest feature, it is evident that the persistence signal decays to the pre-illumination dark level in less than 200 s. A similar decay rate is observed for the other two detectors.
Current usage metrics show cumulative count of Article Views (full-text article views including HTML views, PDF and ePub downloads, according to the available data) and Abstracts Views on Vision4Press platform.
Data correspond to usage on the plateform after 2015. The current usage metrics is available 48-96 hours after online publication and is updated daily on week days.
Initial download of the metrics may take a while.