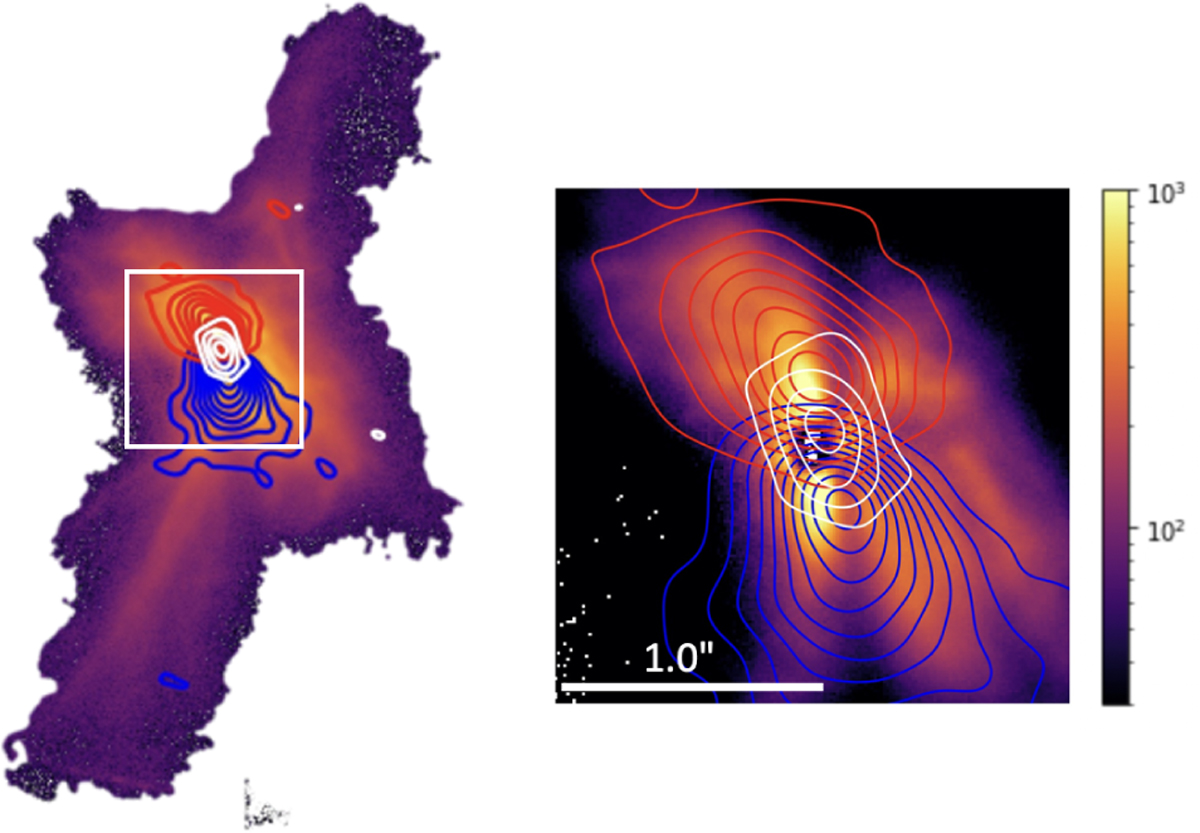
Fig. 7
Download original image
Overlay of SPHERE (color scale) and ALMA (contours) data. On the left all the extended structure as seen with SPHERE, on the right a zoom-in of the innermost 2″. White contours are ALMA 1.3 mm continuum, plotted at contours starting at, and increasing with, 3σ = 0.37 mJy beam−1. Red and blue contours are integrated 12CO 2–1 emission over 10 km s−1 blue- and red-shifted relative to the source velocity, taken as VLSR = 4.5 km s−1. Red and blue contours are also drawn starting at (and increasing with) 3σ = 0.12 Jy beam−1 km s−1. The ALMA data are aligned with the SPHERE data to have the stellar position at the center of the image; the continuum emission peaks ~0.06″ north of that position.
Current usage metrics show cumulative count of Article Views (full-text article views including HTML views, PDF and ePub downloads, according to the available data) and Abstracts Views on Vision4Press platform.
Data correspond to usage on the plateform after 2015. The current usage metrics is available 48-96 hours after online publication and is updated daily on week days.
Initial download of the metrics may take a while.