Fig. 4
Download original image
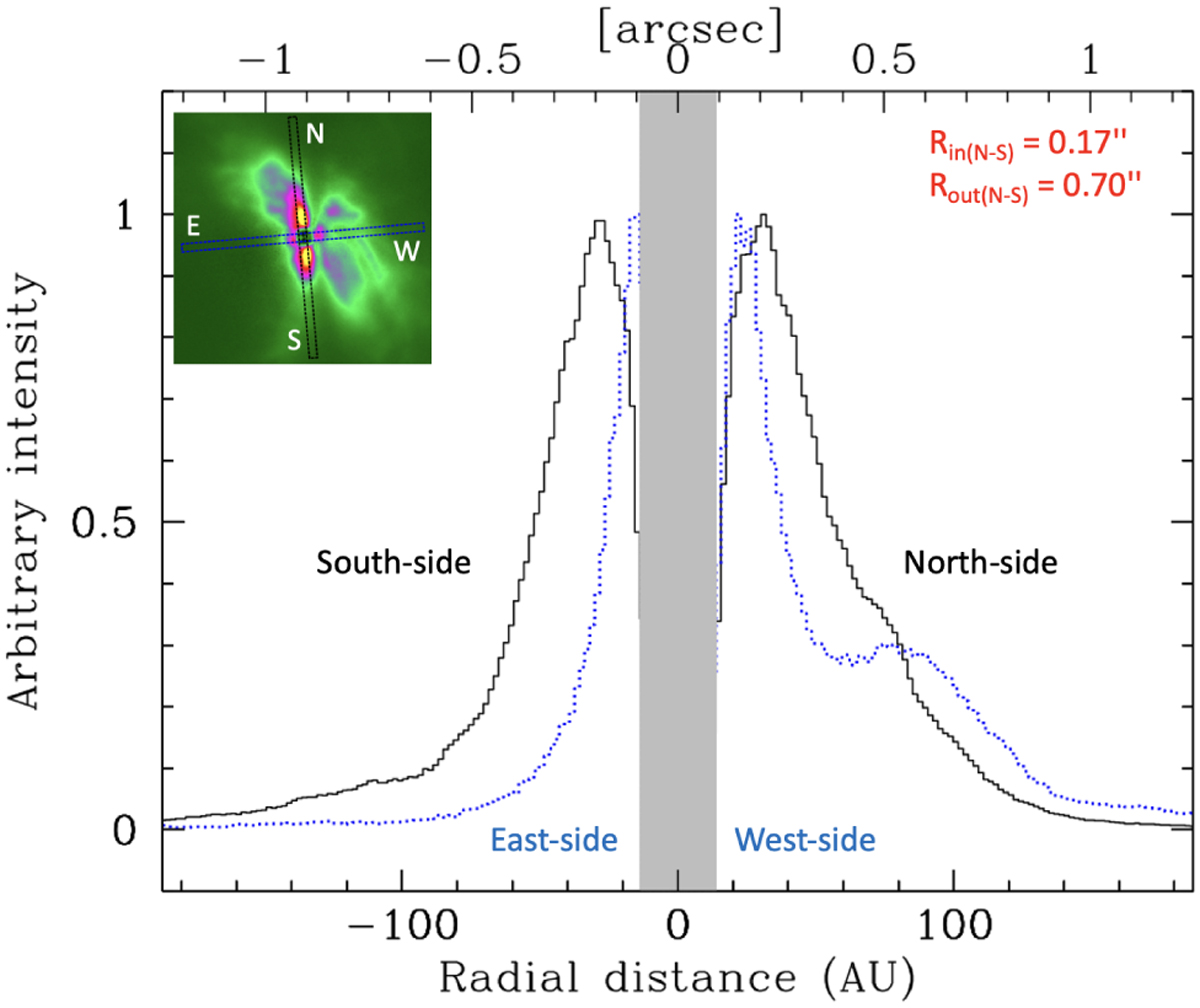
Radial profile of the Qϕ image. The black profile shows the radial profile obtained along a 2.5″ long slice centered on the star in the N–S direction, with PA = 7° and extending along the disk (black-dashed box in the insert). The blue-dotted profile shows the radial profile obtained in the orthogonal direction (E–W, blue-dashed box in the insert). All profiles are normalized to the brightness peak of the disk. The gray area shows the radius of the coronagraph.
Current usage metrics show cumulative count of Article Views (full-text article views including HTML views, PDF and ePub downloads, according to the available data) and Abstracts Views on Vision4Press platform.
Data correspond to usage on the plateform after 2015. The current usage metrics is available 48-96 hours after online publication and is updated daily on week days.
Initial download of the metrics may take a while.