Open Access
Fig. 3
Download original image
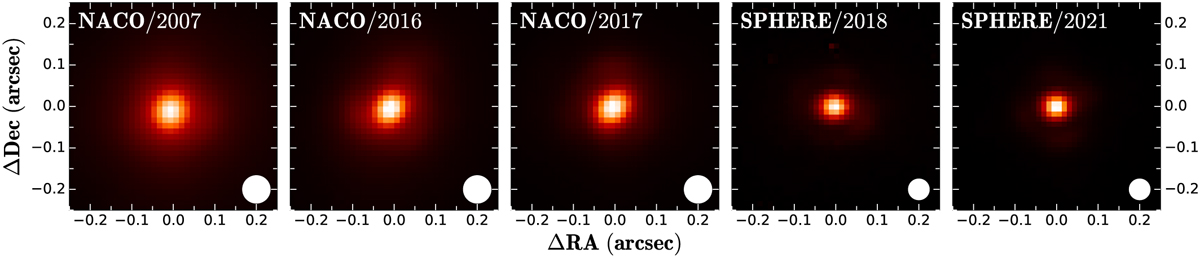
PSF for all the epochs T CrA was observed. The size of the PSF for every single epochs is shown in the bottom-right corner. For the NACO 2016 and 2017 data sets, we notice an elongation of the PSF in the NW-SE direction.
Current usage metrics show cumulative count of Article Views (full-text article views including HTML views, PDF and ePub downloads, according to the available data) and Abstracts Views on Vision4Press platform.
Data correspond to usage on the plateform after 2015. The current usage metrics is available 48-96 hours after online publication and is updated daily on week days.
Initial download of the metrics may take a while.