Fig. 5.
Download original image
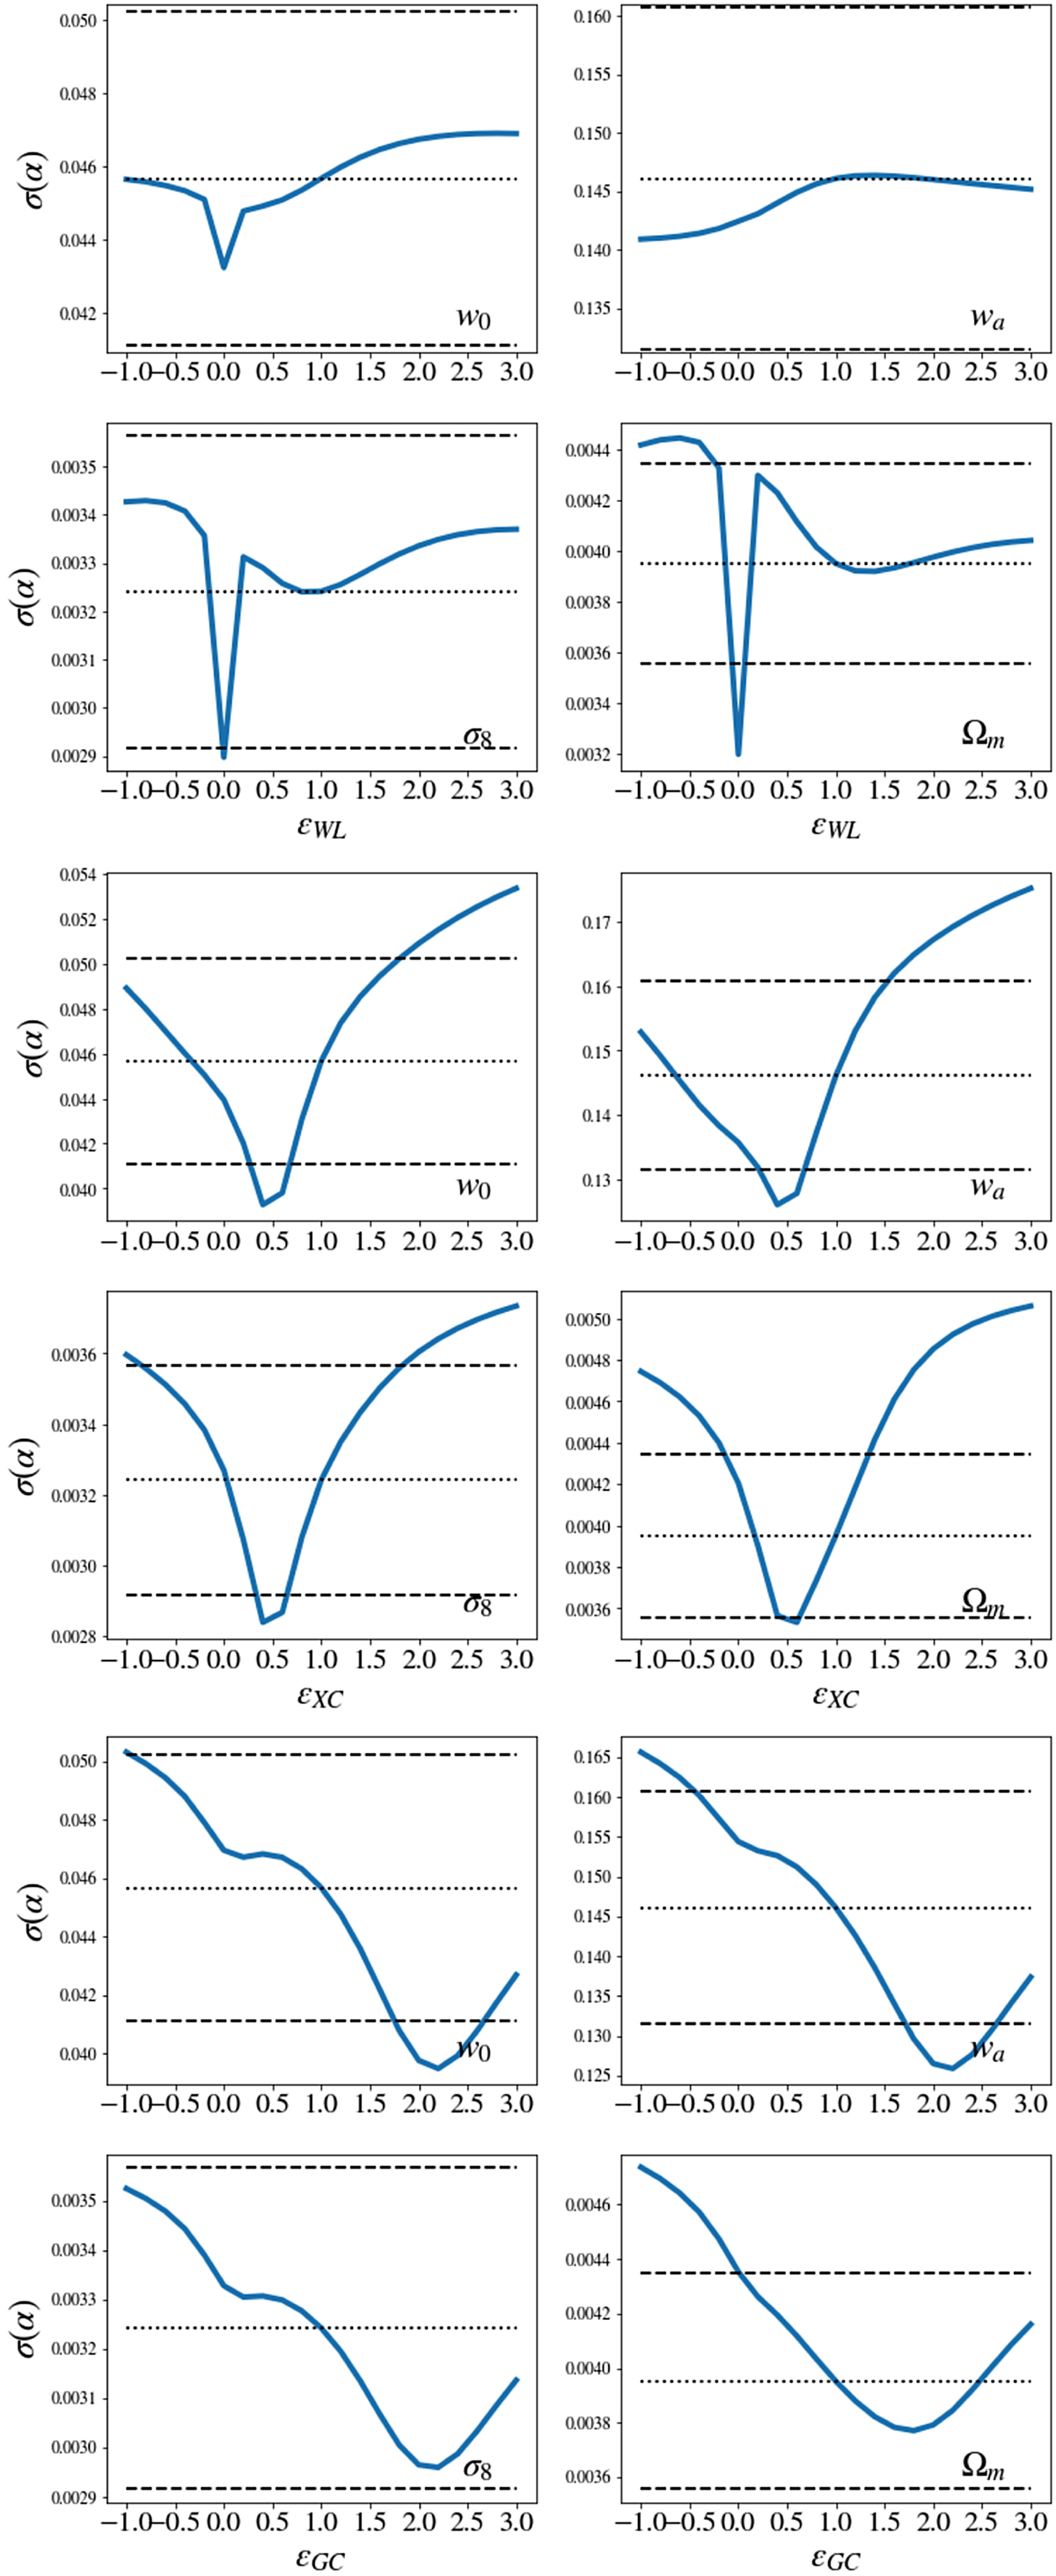
For a 3×2pt analysis, forecast errors on dark energy, σ8, and Ωm. Top: as a function of ϵWL, which changes the WL response alone. Centre: as a function of ϵXC, which changes the cross-correlation response alone. Bottom: as a function of ϵGC, which changes the GC response alone. Dotted line: Value for the fiducial covariance. Dashed lines: ±10% around the dotted line.
Current usage metrics show cumulative count of Article Views (full-text article views including HTML views, PDF and ePub downloads, according to the available data) and Abstracts Views on Vision4Press platform.
Data correspond to usage on the plateform after 2015. The current usage metrics is available 48-96 hours after online publication and is updated daily on week days.
Initial download of the metrics may take a while.