Fig. 7.
Download original image
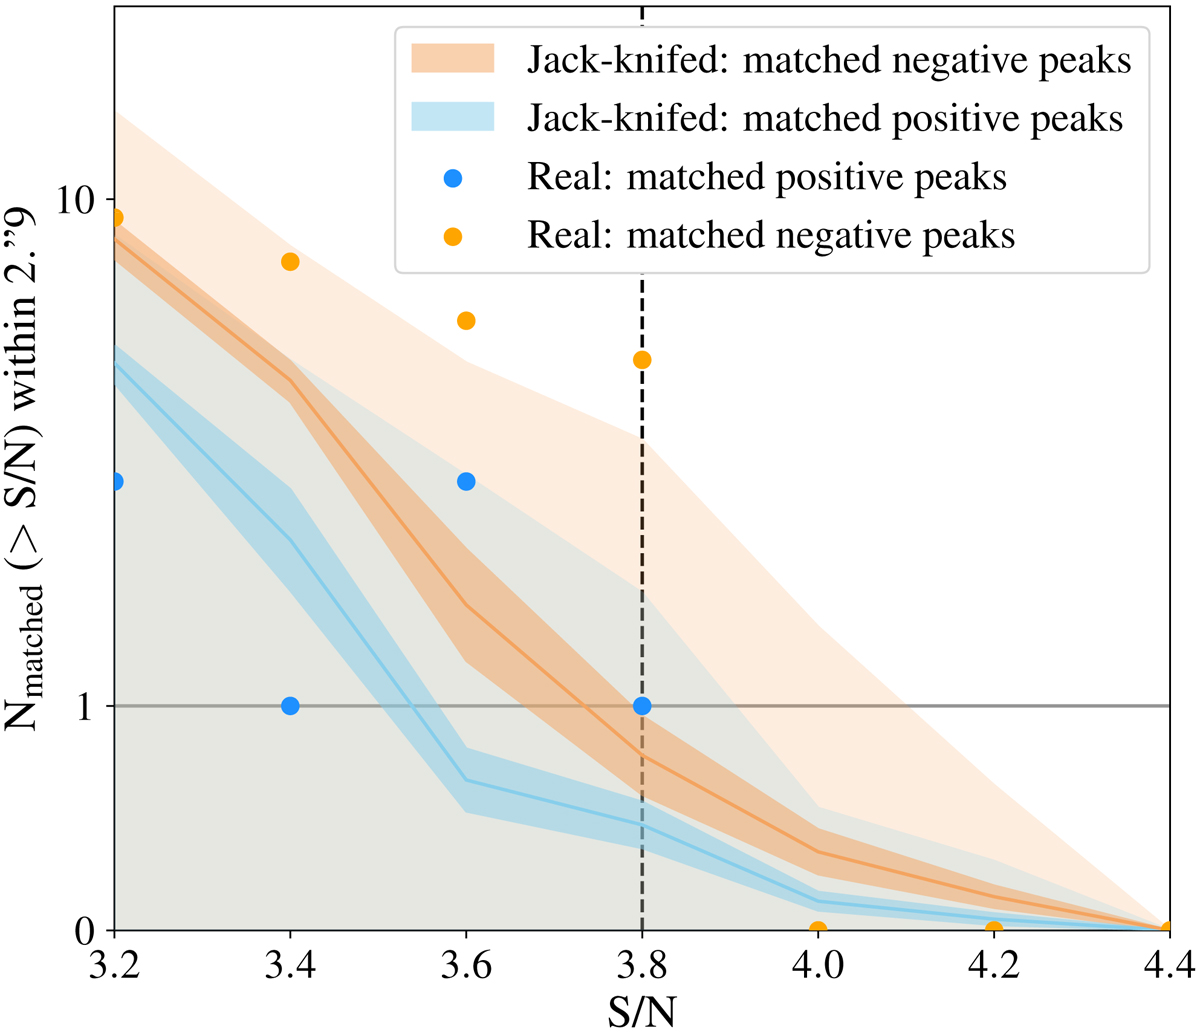
Number of matched peaks, within 1000 km s−1, above a certain S/N and within ![]() of the expected position of HD1. The filled blue and orange circles correspond to the number of positive and negative matched peaks, respectively, in the real data cubes. The solid line, dark- and light shaded regions correspond to the mean, standard deviation and standard error about the mean for the matched pairs of jack-knifed data cubes. We find one matched positive pair in the real data (the tentative [O III] 88 μm and [C II] 158 μm features) at S/N > 3.8. Given the mean and standard deviation on the matched peaks in the jack-knifed data, one set of matched peaks in the real data is perfectly consistent with being noise.
of the expected position of HD1. The filled blue and orange circles correspond to the number of positive and negative matched peaks, respectively, in the real data cubes. The solid line, dark- and light shaded regions correspond to the mean, standard deviation and standard error about the mean for the matched pairs of jack-knifed data cubes. We find one matched positive pair in the real data (the tentative [O III] 88 μm and [C II] 158 μm features) at S/N > 3.8. Given the mean and standard deviation on the matched peaks in the jack-knifed data, one set of matched peaks in the real data is perfectly consistent with being noise.
Current usage metrics show cumulative count of Article Views (full-text article views including HTML views, PDF and ePub downloads, according to the available data) and Abstracts Views on Vision4Press platform.
Data correspond to usage on the plateform after 2015. The current usage metrics is available 48-96 hours after online publication and is updated daily on week days.
Initial download of the metrics may take a while.