Fig. 6.
Download original image
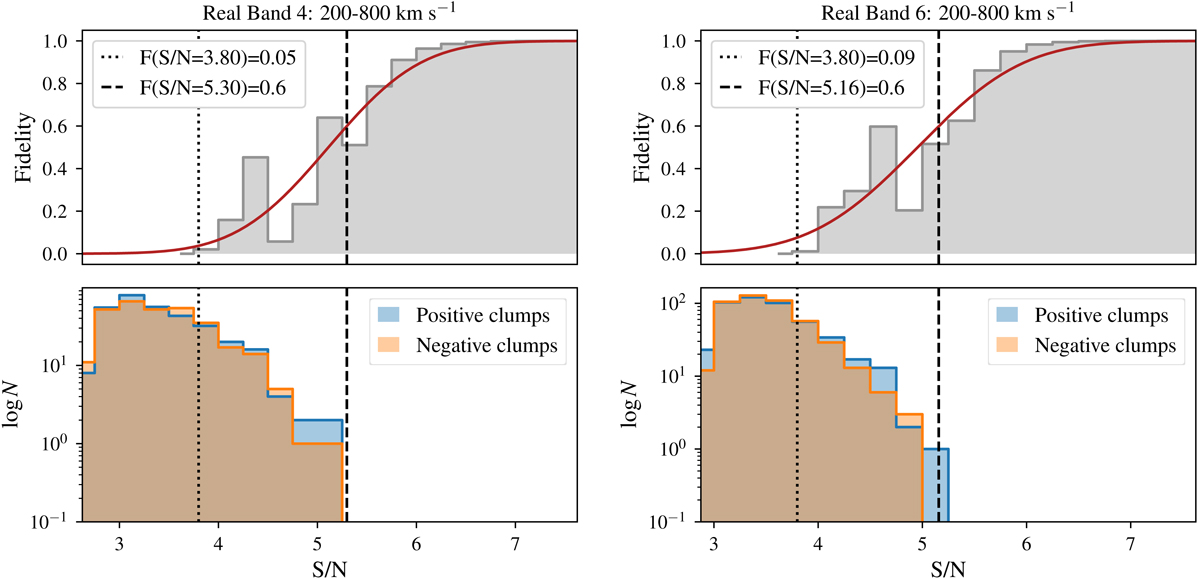
Fidelity (top) and number of peaks found (bottom) as a function of S/N for both the Band 4 data (left) and Band 6 data (right) using Findclumps. The dashed vertical line marks a fidelity of 0.6, beyond which it is more likely to select peaks that are positive than negative. The dotted vertical lines mark the S/N threshold of the tentative [O III] 88 μm and [C II] 158 μm features. The red line in top panels is an error function fit to the fidelity histogram. This functional form has no underlying physical significance but was found empirically to provide a good fit (see Walter et al. 2016).
Current usage metrics show cumulative count of Article Views (full-text article views including HTML views, PDF and ePub downloads, according to the available data) and Abstracts Views on Vision4Press platform.
Data correspond to usage on the plateform after 2015. The current usage metrics is available 48-96 hours after online publication and is updated daily on week days.
Initial download of the metrics may take a while.