Fig. 4.
Download original image
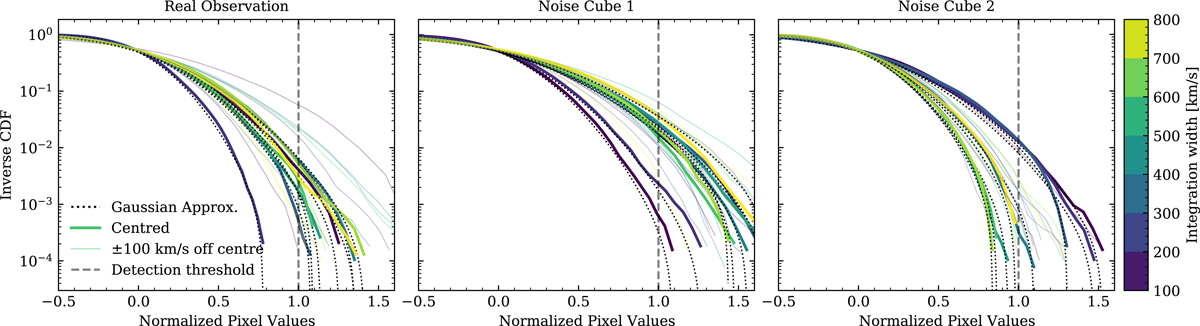
Inverse cumulative distribution of pixel values outside of a 5.2″ aperture mask around the location of HD1, normalised by the brightest pixel value within that mask for different moment-0 maps of the ALMA Band 4 observations. Each moment-0 map is integrated with varying velocities widths (as indicated by the colourbar) and varying central frequencies that are off centred by ±100 km s−1 from the supposed [C II] 158 μm line (which corresponding moment-0 maps are highlighted in bold). The left panel shows the real Band 4 observations, while the middle and right panel show the pixel-distribution of different pure noise observations (see Sect. 3.2). The thin dotted black lines are the assumed Gaussian distribution of the background fluctuations, estimated by computing the mean and standard deviation over the pixel values. Note that the brightest pixel value within the 5.2″ aperture can be interpreted as the peak of the surface brightness of a source. Thus, distributions of pixels values that fall left of the vertical dashed line are indicative of a (tentative) detection within the aperture. For further clarification, see Sect. 3.2.
Current usage metrics show cumulative count of Article Views (full-text article views including HTML views, PDF and ePub downloads, according to the available data) and Abstracts Views on Vision4Press platform.
Data correspond to usage on the plateform after 2015. The current usage metrics is available 48-96 hours after online publication and is updated daily on week days.
Initial download of the metrics may take a while.