Fig. 3.
Download original image
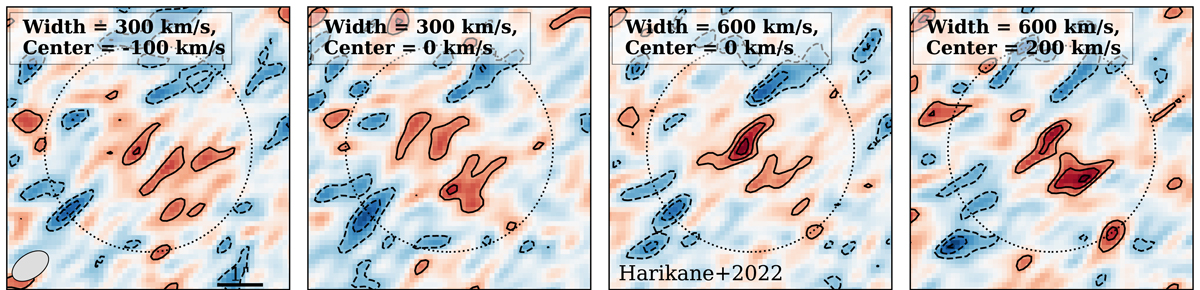
ALMA Band 6 moment-0 maps of HD1. All maps are based on naturally weighted data. Each panel shows a moment-0 map created using a different integration width and central frequency. The integration width and central frequency are provided in km s−1 with respect to the reference frequency, ν = 237.8 GHz, as reported in Harikane et al. (2022), at the top of each panel. For each panel, the contours are drawn at −3.5, −2.5, −1.5, 1.5, 2.5, 3.5-σ. From left to right, the moment-0 maps have rms values of 38.3, 37.4, 51.5, and 52.5 mJy beam−1. The synthesised beam FWHM is indicated by the ellipse in the lower left and the scale of the image is shown on the lower right in the left panel. The dashed circle has a ![]() radius.
radius.
Current usage metrics show cumulative count of Article Views (full-text article views including HTML views, PDF and ePub downloads, according to the available data) and Abstracts Views on Vision4Press platform.
Data correspond to usage on the plateform after 2015. The current usage metrics is available 48-96 hours after online publication and is updated daily on week days.
Initial download of the metrics may take a while.