Fig. 1.
Download original image
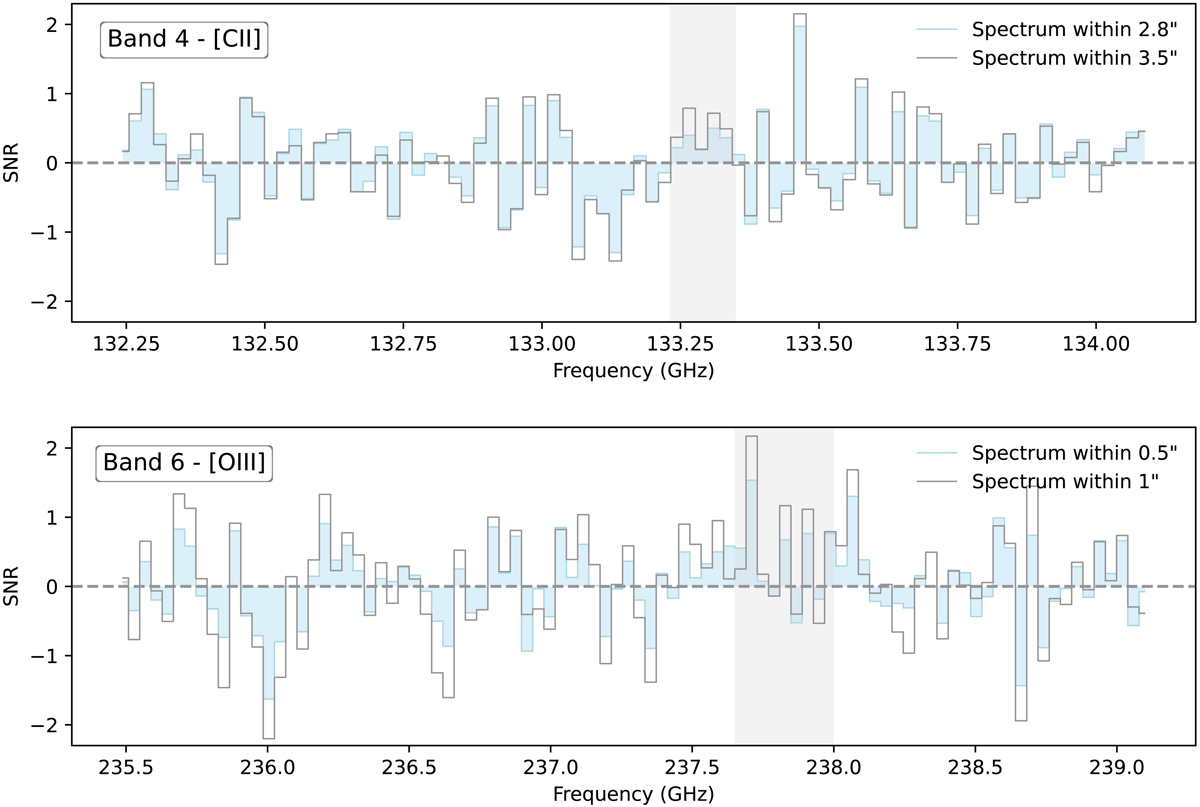
Integrated aperture spectra for HD1 around the expected frequency of the [C II] 158 μm (top panel) and [O III] 88 μm (bottom panel) emission lines. To easily compare the spectra extracted within apertures of different size, spectra are presented in terms of signal-to-noise ratio rather than actual flux density. For the [C II] 158 μm emission we adopt apertures of ![]() and
and ![]() , corresponding to a similar size to the beam and 1.25 times the beam of the ALMA band 4 data, respectively. In the bottom panel we adopt an aperture of
, corresponding to a similar size to the beam and 1.25 times the beam of the ALMA band 4 data, respectively. In the bottom panel we adopt an aperture of ![]() and
and ![]() , corresponding to roughly the beam size and the aperture adopted in Harikane et al. (2022) for the same data, respectively. The grey shaded area marks the tentative [C II] 158 μm feature (top panel), and the location of the [O III] 88 μm line feature presented in Harikane et al. (2022).
, corresponding to roughly the beam size and the aperture adopted in Harikane et al. (2022) for the same data, respectively. The grey shaded area marks the tentative [C II] 158 μm feature (top panel), and the location of the [O III] 88 μm line feature presented in Harikane et al. (2022).
Current usage metrics show cumulative count of Article Views (full-text article views including HTML views, PDF and ePub downloads, according to the available data) and Abstracts Views on Vision4Press platform.
Data correspond to usage on the plateform after 2015. The current usage metrics is available 48-96 hours after online publication and is updated daily on week days.
Initial download of the metrics may take a while.