Fig. 9
Download original image
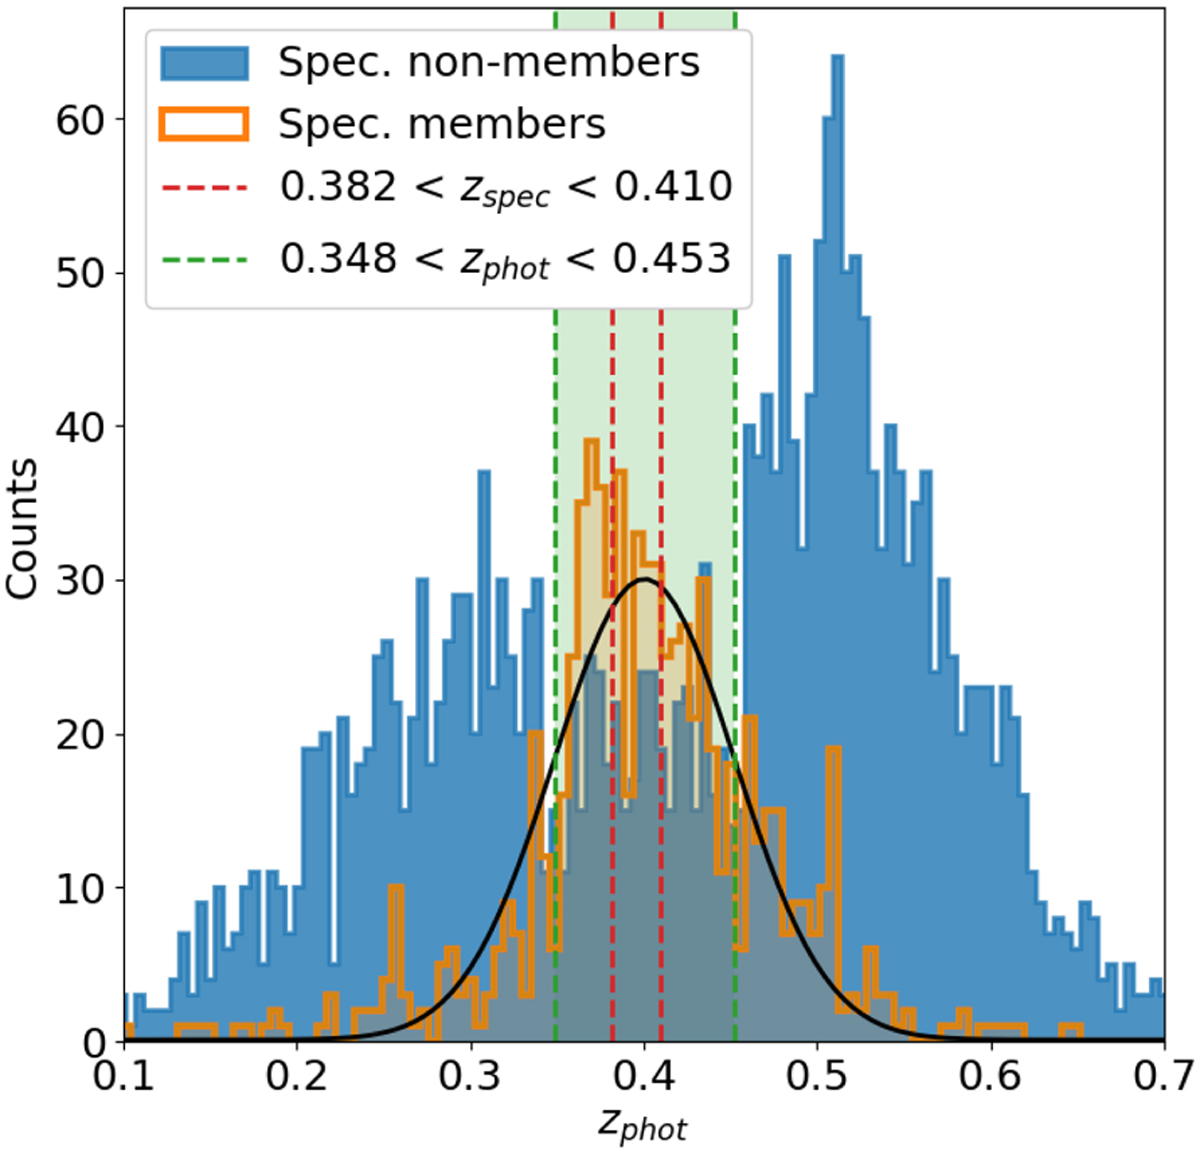
Histogram showing the distribution of photometric redshift for objects with spectroscopic information. In orange are shown the spec-troscopic cluster members, described by a Gaussian curve (black line). The photometric cluster interval is shown in green and corresponds to the one-sigma dispersion of the Gaussian curve σ = 0.052. In blue are shown the objects with a spectroscopic redshift outside the cluster interval.
Current usage metrics show cumulative count of Article Views (full-text article views including HTML views, PDF and ePub downloads, according to the available data) and Abstracts Views on Vision4Press platform.
Data correspond to usage on the plateform after 2015. The current usage metrics is available 48-96 hours after online publication and is updated daily on week days.
Initial download of the metrics may take a while.