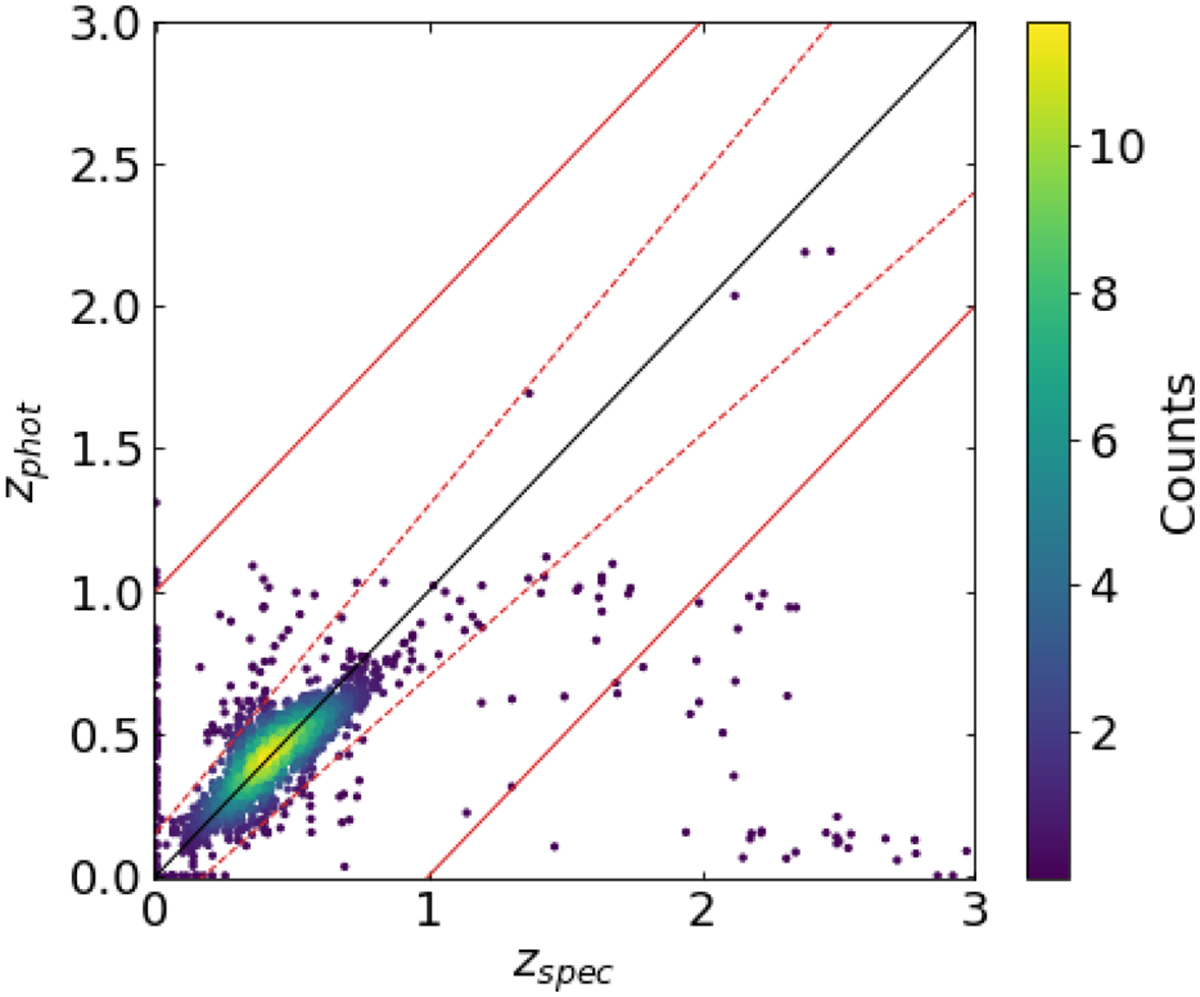
Fig. 6
Download original image
Results of the SED fitting procedure, before optimizing it into our redshift range. The figure shows the photometric redshift as a function of spectroscopic redshift. The internal red dotted lines indicate the limit for which |∆z| = |(zphot − zspec)/(1 + zspec)| > 0.15, which defines the outliers. Red continuos lines indicate the limit for catastrophic outliers |zphot − zspec| > 1. The outlier fraction is 6.06% and the σnmad is 0.0418.
Current usage metrics show cumulative count of Article Views (full-text article views including HTML views, PDF and ePub downloads, according to the available data) and Abstracts Views on Vision4Press platform.
Data correspond to usage on the plateform after 2015. The current usage metrics is available 48-96 hours after online publication and is updated daily on week days.
Initial download of the metrics may take a while.