Open Access
Fig. 3
Download original image
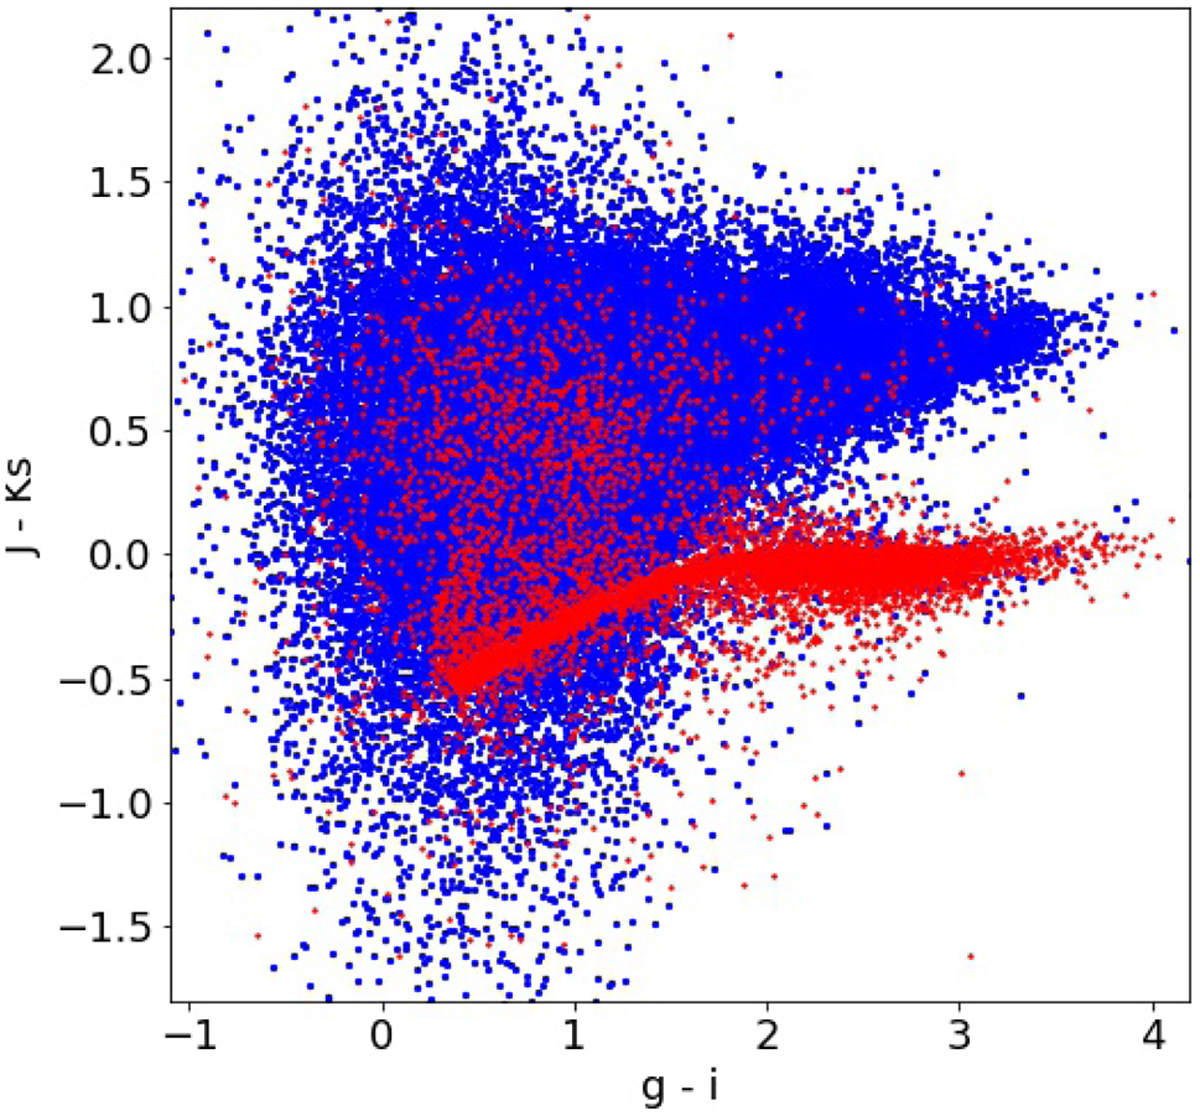
J - Ks versus ɡ – i color-color diagram, using aperture magnitudes within 3″ diameter to visualise the star/galaxy separation. Here, stars are in red and galaxies in blue. The contamination of red points on the galaxy region with J – Ks > 0.2 is 14.8% and agrees with the 17.3% expected from the spectroscopic sample.
Current usage metrics show cumulative count of Article Views (full-text article views including HTML views, PDF and ePub downloads, according to the available data) and Abstracts Views on Vision4Press platform.
Data correspond to usage on the plateform after 2015. The current usage metrics is available 48-96 hours after online publication and is updated daily on week days.
Initial download of the metrics may take a while.