Fig. 2
Download original image
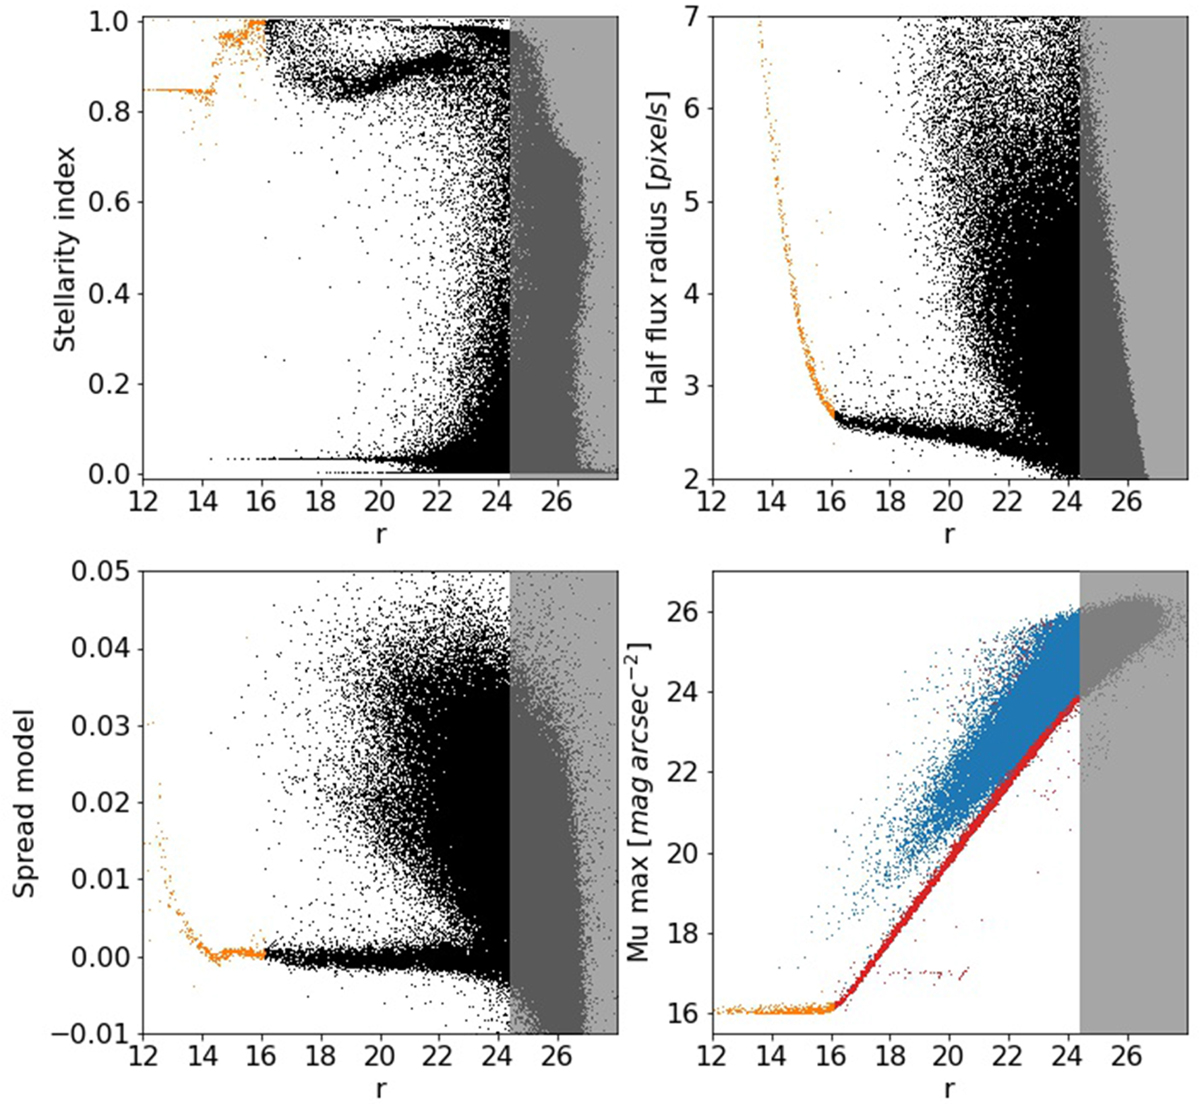
Star/galaxy separation. Diagram of the SExtractor CLASS_STAR (top-left panel), HALF_FLUX_RADIUS_58 (top-right panel), and SPREAD_MODEL (bottom-left panel), as a function of Kron magnitude for sources detected in the r band (black points), with the loci of saturated stars colored in orange. The gray-shaded area corresponds to the area beyond the completeness limit of the r band. In the bottom-right panel we plot the SExtractor MU_MAX parameter as a function of the Kron magnitude for sources detected in the r band, color-coded according to their classification: galaxies in blue, saturated stars in orange, unsaturated stars in red.
Current usage metrics show cumulative count of Article Views (full-text article views including HTML views, PDF and ePub downloads, according to the available data) and Abstracts Views on Vision4Press platform.
Data correspond to usage on the plateform after 2015. The current usage metrics is available 48-96 hours after online publication and is updated daily on week days.
Initial download of the metrics may take a while.