Fig. 15
Download original image
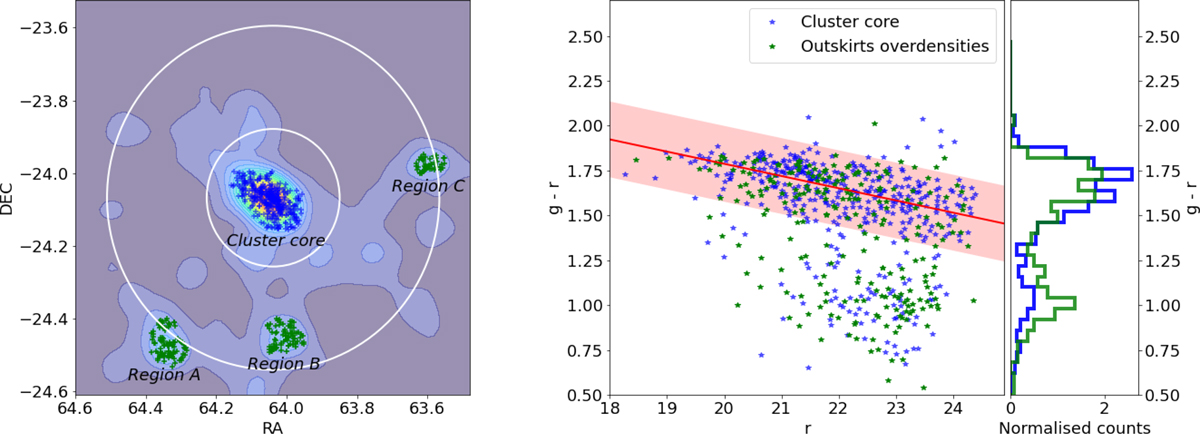
Analysis of galaxy properties on outskirts overdensities. Left: selection of the three overdense regions in the cluster outskirts r > 2r200. The background shows the density field computed with the red galaxy sample (bottom panel of Fig. 11). The crosses over the plot correspond to galaxies in overdense environments with δ > 1. Regions A, B, and C are determined using the red-sequence density field. White circles are the same as those in Fig 11. Middle: detailed analysis of the color-magnitude diagram shown on panel a of Fig. 14. The red stripe represents the red sequence found with spectroscopic cluster members. Blue points are galaxies with δ > 1 .5, which corresponds to the cluster core. Green points are galaxies related to the three sub-structures (Regions A, B, and C) in the cluster outskirts at r > 2r200. Right: histogram of the ɡ − r color for both galaxy samples shown in the central panel.
Current usage metrics show cumulative count of Article Views (full-text article views including HTML views, PDF and ePub downloads, according to the available data) and Abstracts Views on Vision4Press platform.
Data correspond to usage on the plateform after 2015. The current usage metrics is available 48-96 hours after online publication and is updated daily on week days.
Initial download of the metrics may take a while.