Fig. 14
Download original image
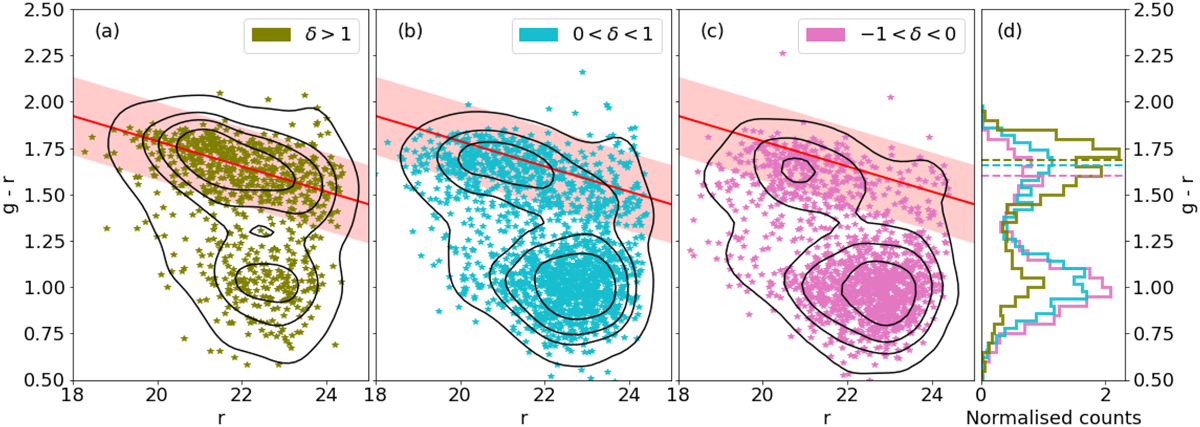
Analysis of color-magnitude diagram dividing the galaxy sample (gray points of Fig. 10) according to the local environment. The color-code follows that of Fig. 13. Panel a contains galaxies in the densest environments of the field, including the cluster core and outskirts overdensities. Panel b contains galaxies in denser environments up to two times the mean density. Panel c contains galaxies in environments less dense than the mean density of the field. Panel d shows a normalized histogram of the ɡ − r color for the three galaxy samples. Horizontal dashed lines represent the location of the peaks of the distributions (see text for details). The percentage of red galaxies is 65.2, 32.8, and 21.1% for the three density environments respectively, showing a clear abundance of red galaxies in the densest regions of the field. The black contours in each plot contain 5, 25, 50, and 75% of the galaxies for each sample. The red line and the red area represent the sequence of red galaxies obtained with the spectroscopic cluster sample.
Current usage metrics show cumulative count of Article Views (full-text article views including HTML views, PDF and ePub downloads, according to the available data) and Abstracts Views on Vision4Press platform.
Data correspond to usage on the plateform after 2015. The current usage metrics is available 48-96 hours after online publication and is updated daily on week days.
Initial download of the metrics may take a while.