Fig. 13
Download original image
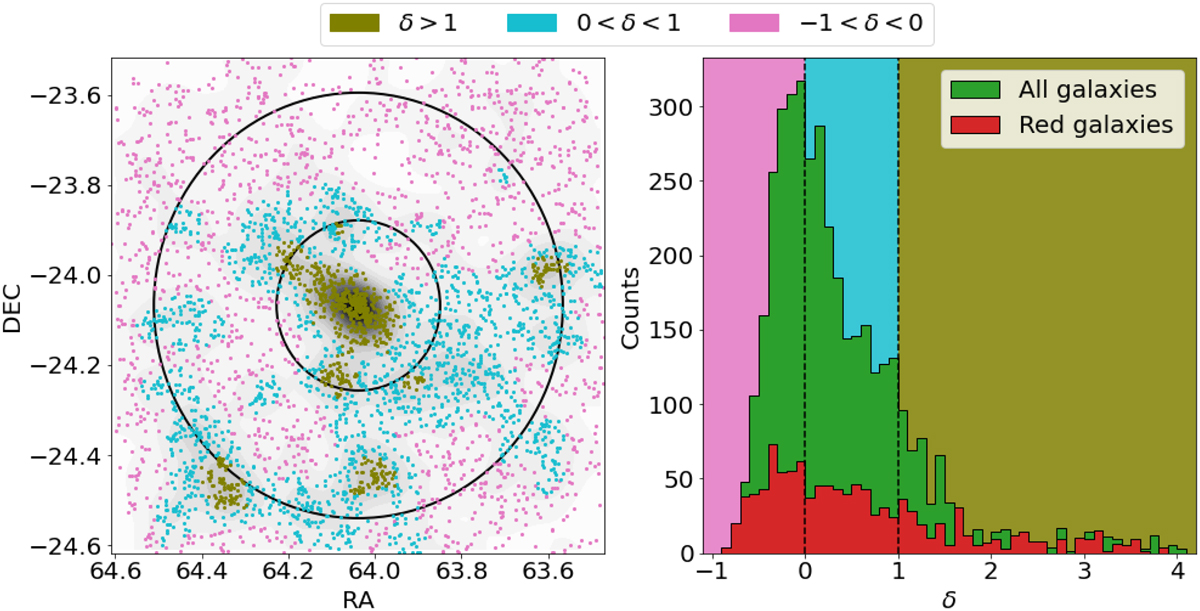
Characterization of galaxies according to their local density. Left: environment classification of galaxies with 0.348 < zphot < 0.453 across the VST-GAME MACS0416 field. Colors correspond to the three density intervals chosen for this work. Black circles indicate 3.64 Mpc and 9.1 Mpc which correspond to 2r200 and 5r200, respectively. Right: distribution of galaxies according to their local density. The green histogram is computed with all the galaxies within the cluster interval, while the red histogram is made with red galaxies. Filled stripes identify the density intervals chosen as environment tracers.
Current usage metrics show cumulative count of Article Views (full-text article views including HTML views, PDF and ePub downloads, according to the available data) and Abstracts Views on Vision4Press platform.
Data correspond to usage on the plateform after 2015. The current usage metrics is available 48-96 hours after online publication and is updated daily on week days.
Initial download of the metrics may take a while.