Fig. 10
Download original image
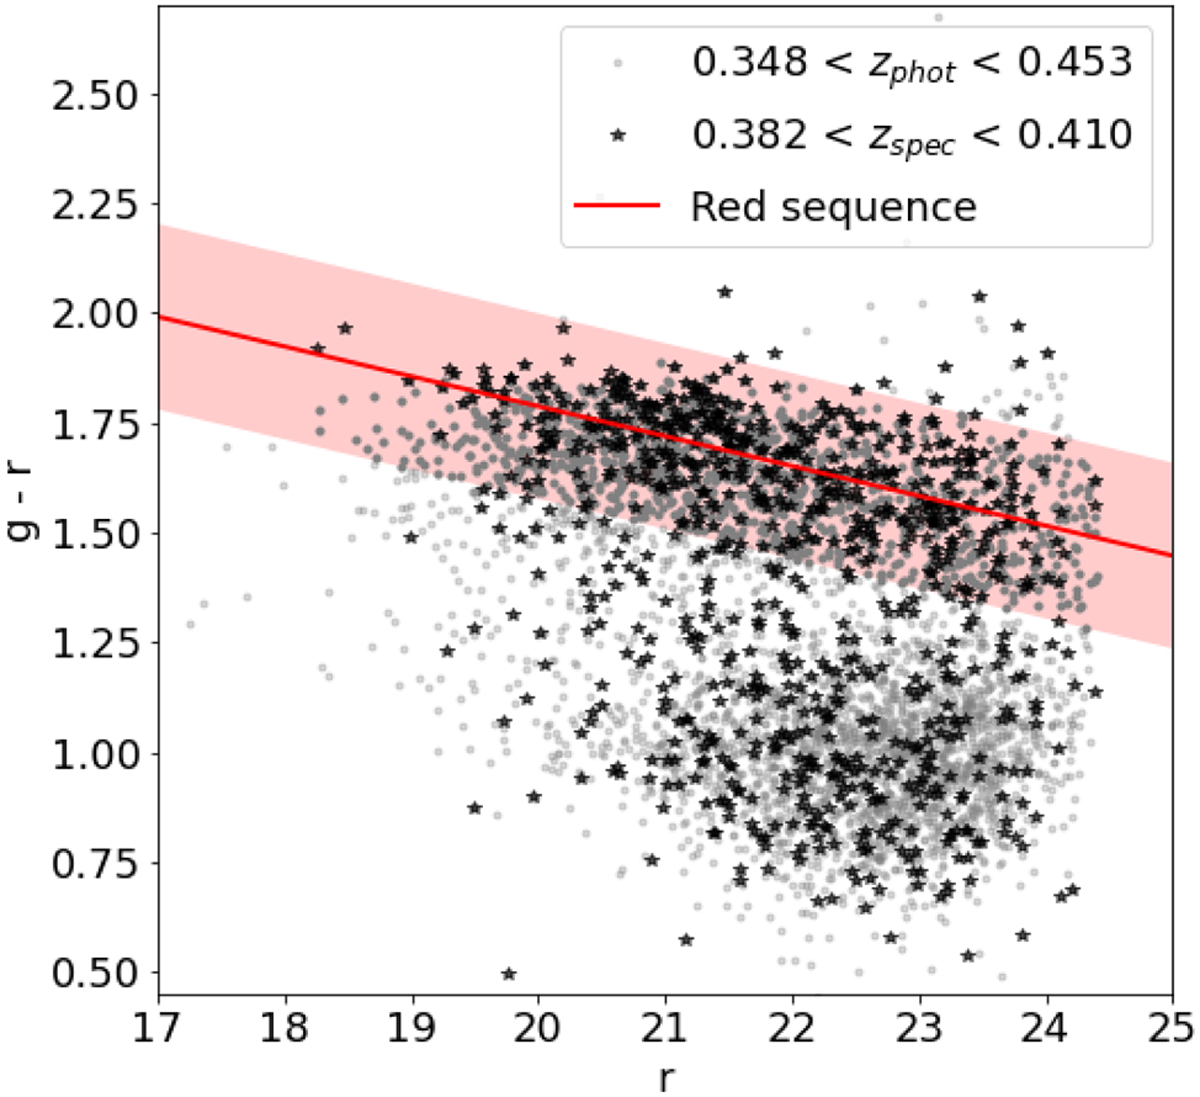
Color magnitude diagram for MACS0416 cluster members using VST photometry. Color is determined using ɡ and r band aperture magnitudes of 3.0″. The x-axis shows the Kron magnitude for the r band. The sequence of red galaxies is determined with spectroscopic cluster members (black stars in the figure), first splitting the sample in two and then fitting a linear relation in the upper part of the plane. The red line determines the best fit for red galaxies and the red shadow area represents the 2.6σ region around the fit. Grey points are galaxies with photometric redshift within the cluster interval.
Current usage metrics show cumulative count of Article Views (full-text article views including HTML views, PDF and ePub downloads, according to the available data) and Abstracts Views on Vision4Press platform.
Data correspond to usage on the plateform after 2015. The current usage metrics is available 48-96 hours after online publication and is updated daily on week days.
Initial download of the metrics may take a while.