Fig. 5
Download original image
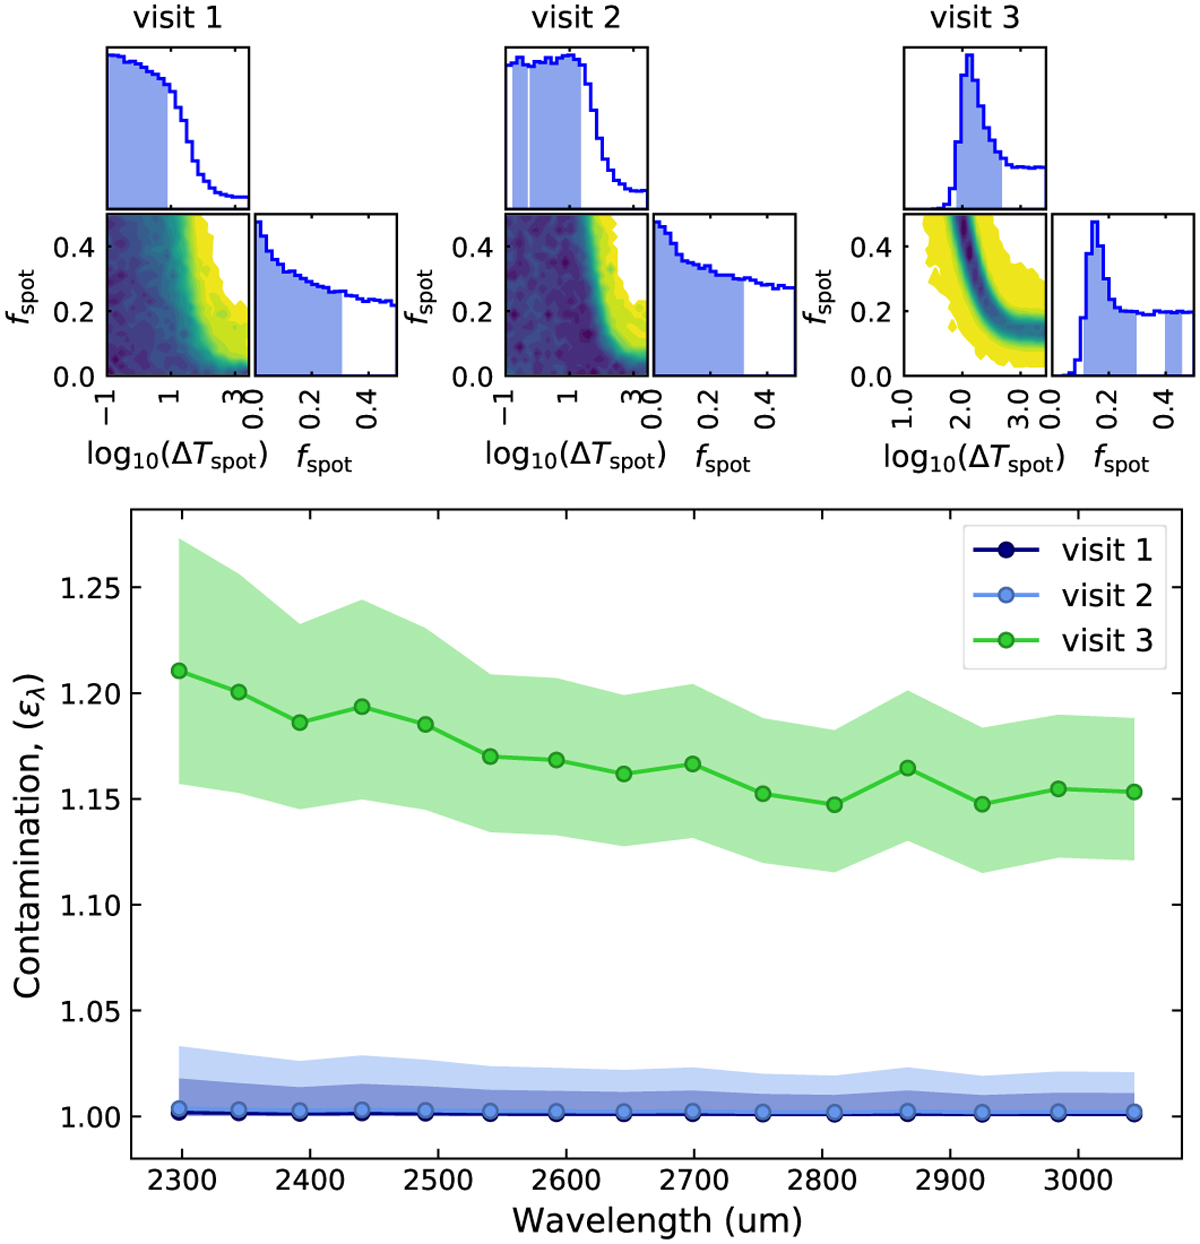
Stellar spot contamination. The top panels show the posterior distribution of the spot parameters derived from the combined data analysis. The blue shaded areas denote the 1σ highest posterior density credible region. Visits 1 and 2 show a negligible spot contamination with either a small spot covering fraction or a negligible difference between the spot and photospheric temperatures. Visit 3 in contrast shows a non-negligible contamination of ϵ(λ) ~ 1.15–1.2, with a strong correlation between the spot covering fraction and spot temperature. The bottom panel shows the respective contamination spectra. The colored symbols and vertical spans show the median and 1σ uncertainty of the contamination, respectively.
Current usage metrics show cumulative count of Article Views (full-text article views including HTML views, PDF and ePub downloads, according to the available data) and Abstracts Views on Vision4Press platform.
Data correspond to usage on the plateform after 2015. The current usage metrics is available 48-96 hours after online publication and is updated daily on week days.
Initial download of the metrics may take a while.