Fig. 4
Download original image
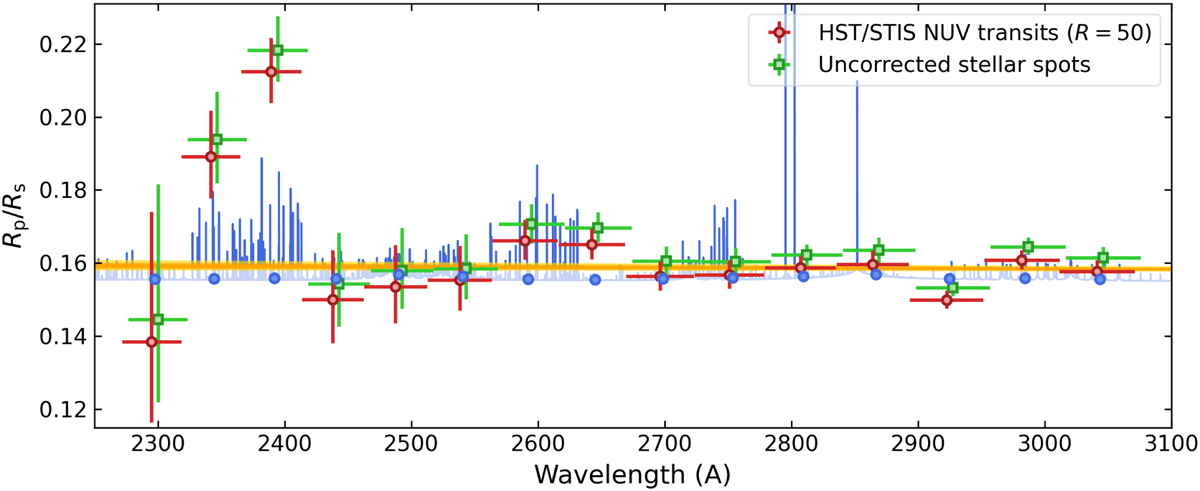
Near-UV transmission spectrum of HD 189733 b from the combined HST/STIS observations. The red symbols with error bars denote the systematics- and stellar spot-corrected transmission spectrum, their 1σ uncertainties, and the span of the spectral bins (the data is binned in wavelength over a resolving power of R = 50). The green symbols show our results when neglecting the stellar spot contamination in the analysis (symbols are slightly shifted in wavelength for visibility). The blue spectrum shows a theoretical model of the planet’s upper atmosphere (see Sect. 5.1) and the blue dots show the model integrated over the spectral bins. The orange curve shows an extrapolation from a fit to the optical–IR transmission spectrum of the planet (see Sect. 5.2).
Current usage metrics show cumulative count of Article Views (full-text article views including HTML views, PDF and ePub downloads, according to the available data) and Abstracts Views on Vision4Press platform.
Data correspond to usage on the plateform after 2015. The current usage metrics is available 48-96 hours after online publication and is updated daily on week days.
Initial download of the metrics may take a while.