Fig. 3
Download original image
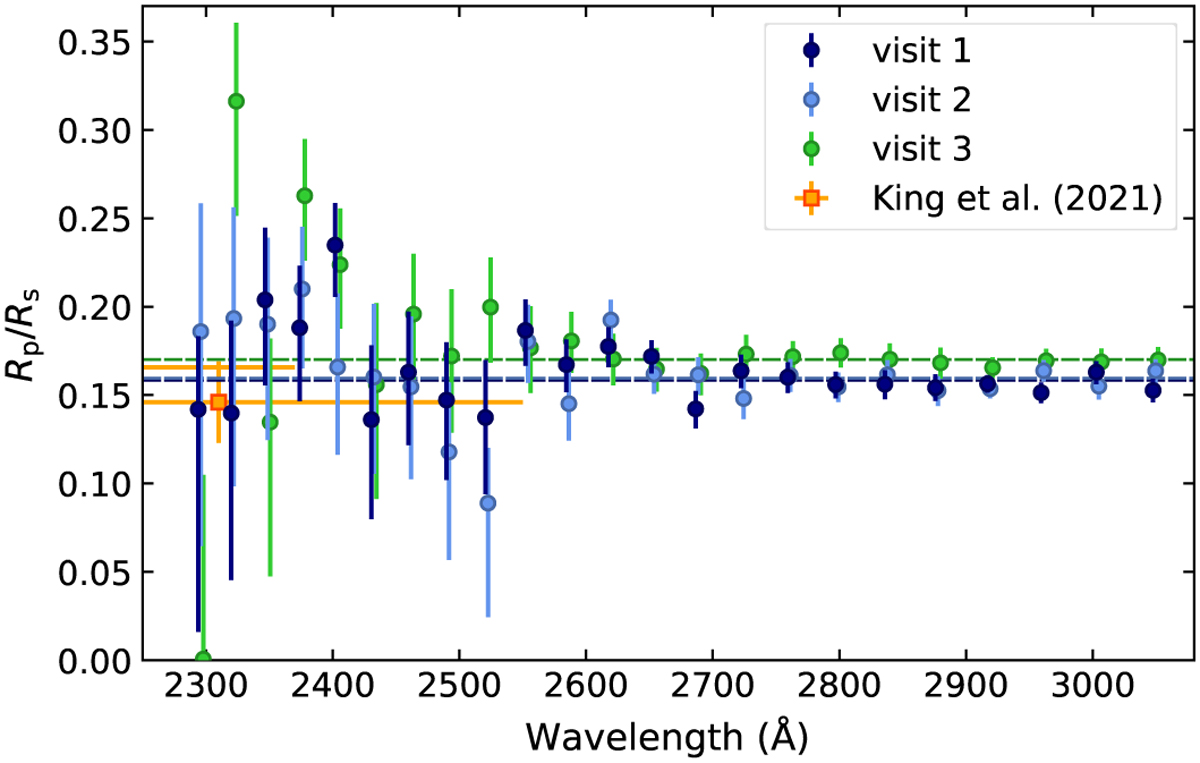
HST/STIS NUV transmission spectrum of HD 189733 b (individual visits). The circles with error bars denote the transmission planet-to-star radius ratios from each echelle order and visit (see legend), corresponding to the best AICc fits. The colored dashed lines denote the mean value for each visit. The squares denote the XMM-Newton/UVM2 photometric measurement by King et al. (2021).
Current usage metrics show cumulative count of Article Views (full-text article views including HTML views, PDF and ePub downloads, according to the available data) and Abstracts Views on Vision4Press platform.
Data correspond to usage on the plateform after 2015. The current usage metrics is available 48-96 hours after online publication and is updated daily on week days.
Initial download of the metrics may take a while.