Fig. 2
Download original image
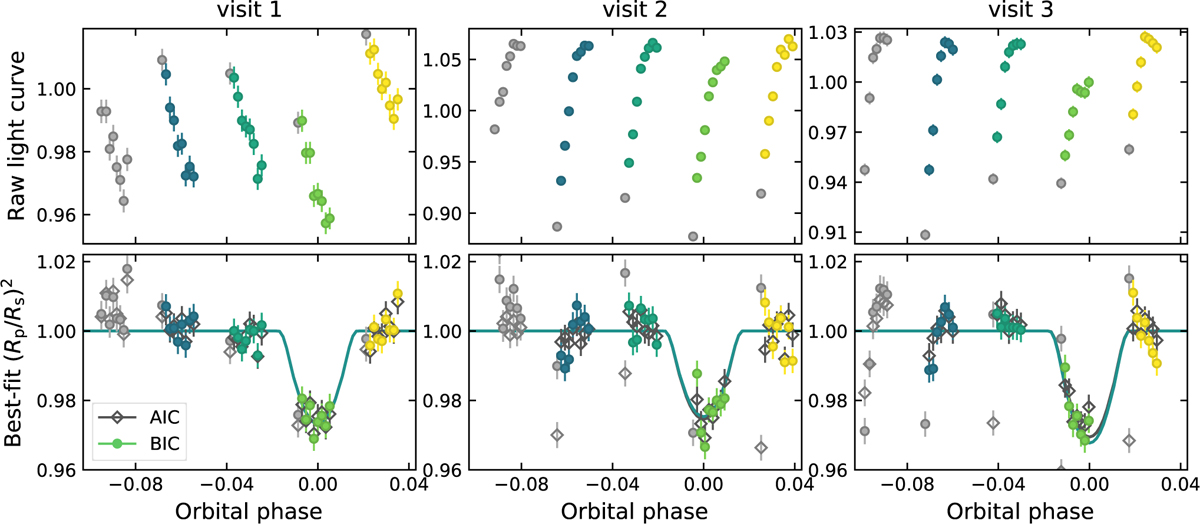
Sample transmission light curve fitting of the HST/STIS observations of HD 189733 b (fourth echelle order, ![]() ). The top row shows the raw light curves (one column for each of the three visits). The symbols with error bars denote the fluxes and their uncertainties integrated over the echelle order for each frame. The symbols are color-coded according to the HST orbit, where gray denotes the frames discarded from the light curve fitting. The bottom rows show the systematics-corrected light curves corresponding to the best BIC (colored circles) and best AICc statistics (empty black diamonds), including the jitter decorrelation. The solid lines denote the astrophysical model of the best BIC (colored lines) and best AICc models (black lines).
). The top row shows the raw light curves (one column for each of the three visits). The symbols with error bars denote the fluxes and their uncertainties integrated over the echelle order for each frame. The symbols are color-coded according to the HST orbit, where gray denotes the frames discarded from the light curve fitting. The bottom rows show the systematics-corrected light curves corresponding to the best BIC (colored circles) and best AICc statistics (empty black diamonds), including the jitter decorrelation. The solid lines denote the astrophysical model of the best BIC (colored lines) and best AICc models (black lines).
Current usage metrics show cumulative count of Article Views (full-text article views including HTML views, PDF and ePub downloads, according to the available data) and Abstracts Views on Vision4Press platform.
Data correspond to usage on the plateform after 2015. The current usage metrics is available 48-96 hours after online publication and is updated daily on week days.
Initial download of the metrics may take a while.