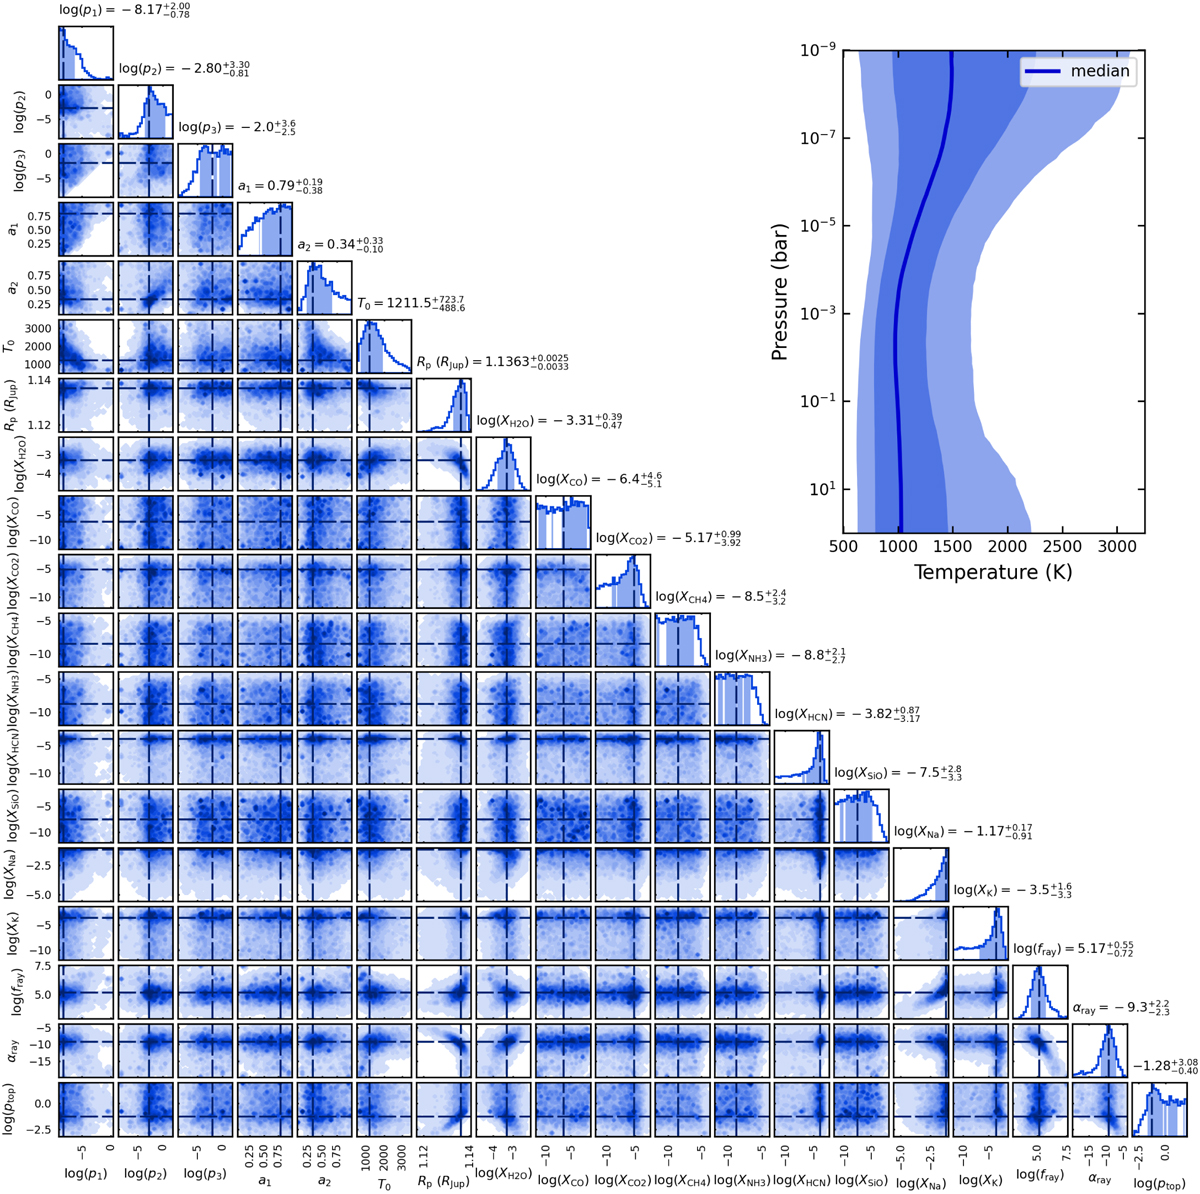
Fig. B.1
Download original image
Pairwise distribution (lower left corner panels) and marginal histograms (diagonal) of the retrieved posterior parameters of the HD 189733 b optical–IR retrieval. The dashed lines indicate the marginal maximum likelihood of the parameters (i.e., the mode of the histograms or median when the parameter not well constrained). The shaded areas denote the 68% highest posterior density. The top right panel shows the posterior distribution of the temperature-profile models; the median and the span of the 68% and 95% central credible intervals.
Current usage metrics show cumulative count of Article Views (full-text article views including HTML views, PDF and ePub downloads, according to the available data) and Abstracts Views on Vision4Press platform.
Data correspond to usage on the plateform after 2015. The current usage metrics is available 48-96 hours after online publication and is updated daily on week days.
Initial download of the metrics may take a while.