Fig. A.2
Download original image
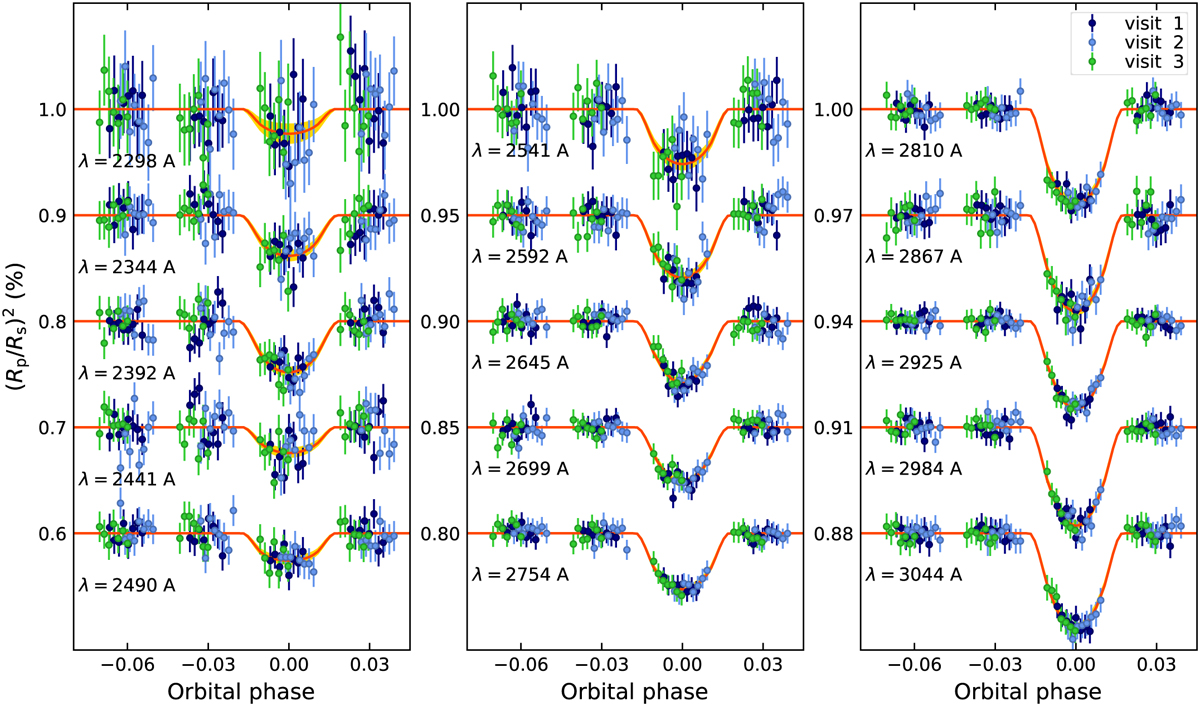
Transit light curves of the combined HST/STIS observations of HD 189733 b binned at a resolving power of R = 50. The colored symbols with error bars denote the systematics- and stellar spot-corrected measurements, color-coded for each visit (see legend). The solid red curve and orange area denote the best-fitting transit depths and span of their 1σ uncertainties. The light curve of each bin has been shifted in the vertical axis for visualization. The labels next to each light curve denotes the mean wavelength of the spectral bin. The scale of the vertical axis changes from left to right as the S/N of the data improves with increasing wavelength.
Current usage metrics show cumulative count of Article Views (full-text article views including HTML views, PDF and ePub downloads, according to the available data) and Abstracts Views on Vision4Press platform.
Data correspond to usage on the plateform after 2015. The current usage metrics is available 48-96 hours after online publication and is updated daily on week days.
Initial download of the metrics may take a while.