Fig. 1
Download original image
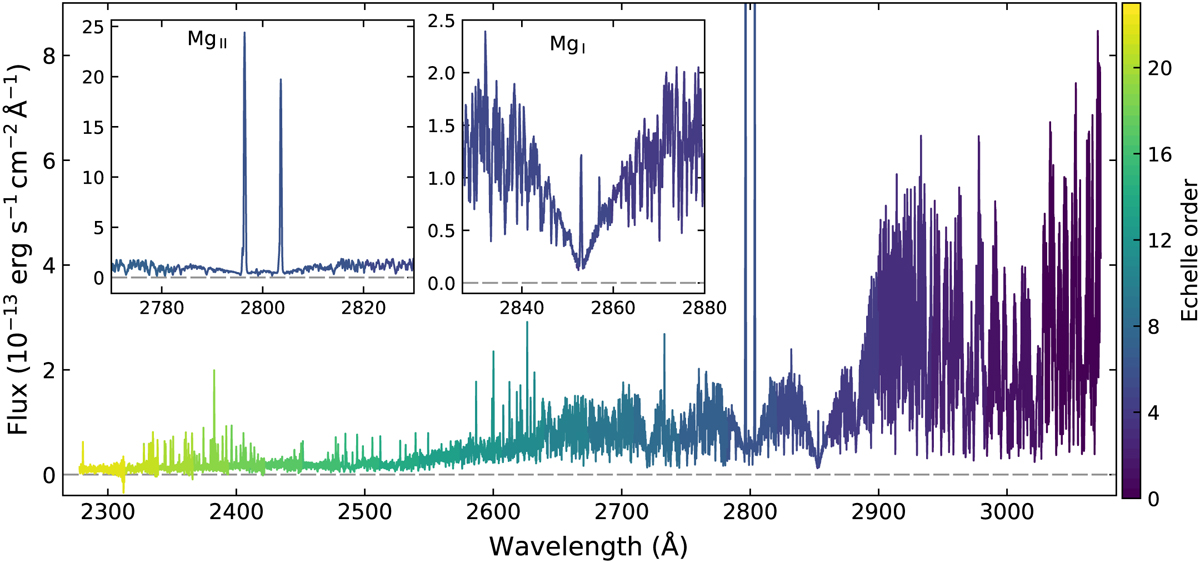
HD 189733 system flux as observed by HST/STIS. This spectrum was constructed from the mean time series spectra obtained during the first visit, after discarding bad pixels. The spectrum is color-coded by echelle order (see color bar on the right). The insets show zoomed-in images around the location of the Mg II and Mg I resonance lines.
Current usage metrics show cumulative count of Article Views (full-text article views including HTML views, PDF and ePub downloads, according to the available data) and Abstracts Views on Vision4Press platform.
Data correspond to usage on the plateform after 2015. The current usage metrics is available 48-96 hours after online publication and is updated daily on week days.
Initial download of the metrics may take a while.