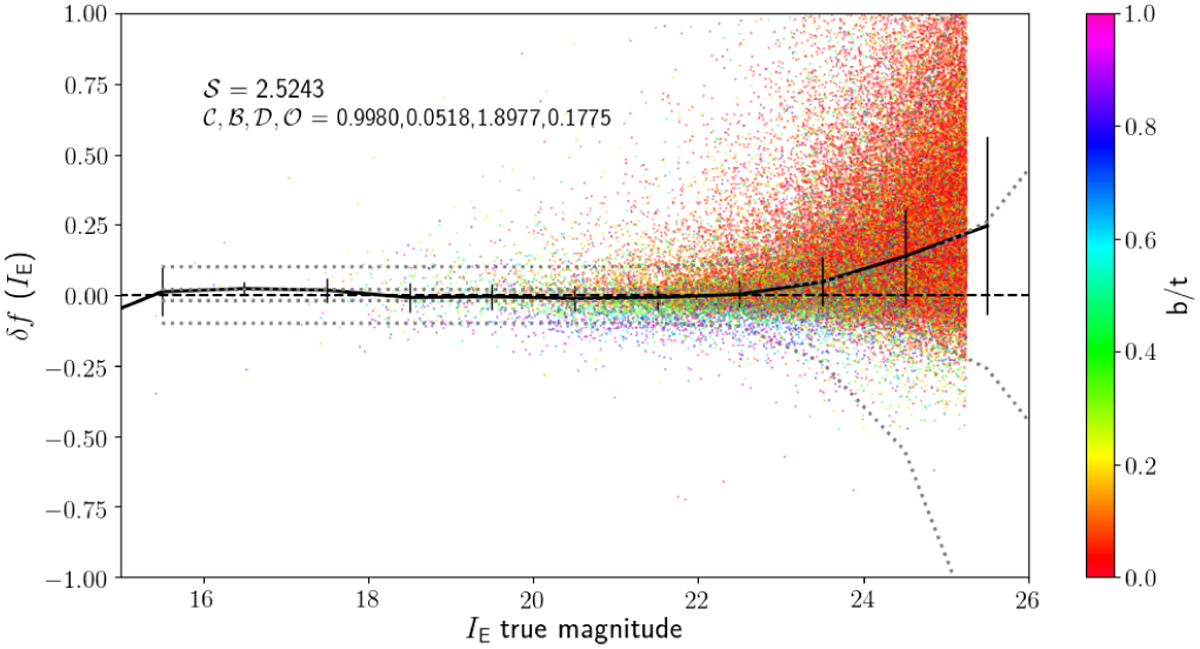
Fig. 8
Download original image
Example of a diagnostic plot used to analyse each output catalogue provided by the participants to the EMC. Each dot shows the δf value of a fitted galaxy, colour-coded by the b/t value from the original Egg catalogue (colour-bar on the right), as a function of the input true magnitude in the considered band. The black solid line is the running median of the distribution, which should be identically zero for a perfect fit. The dotted lines show the (positive and negative) 1 and 5 levels, used to compute the diagnostics described in the text and reported in the top left corner of the plot (see Sect. 4).
Current usage metrics show cumulative count of Article Views (full-text article views including HTML views, PDF and ePub downloads, according to the available data) and Abstracts Views on Vision4Press platform.
Data correspond to usage on the plateform after 2015. The current usage metrics is available 48-96 hours after online publication and is updated daily on week days.
Initial download of the metrics may take a while.