Open Access
Fig. B.9
Download original image
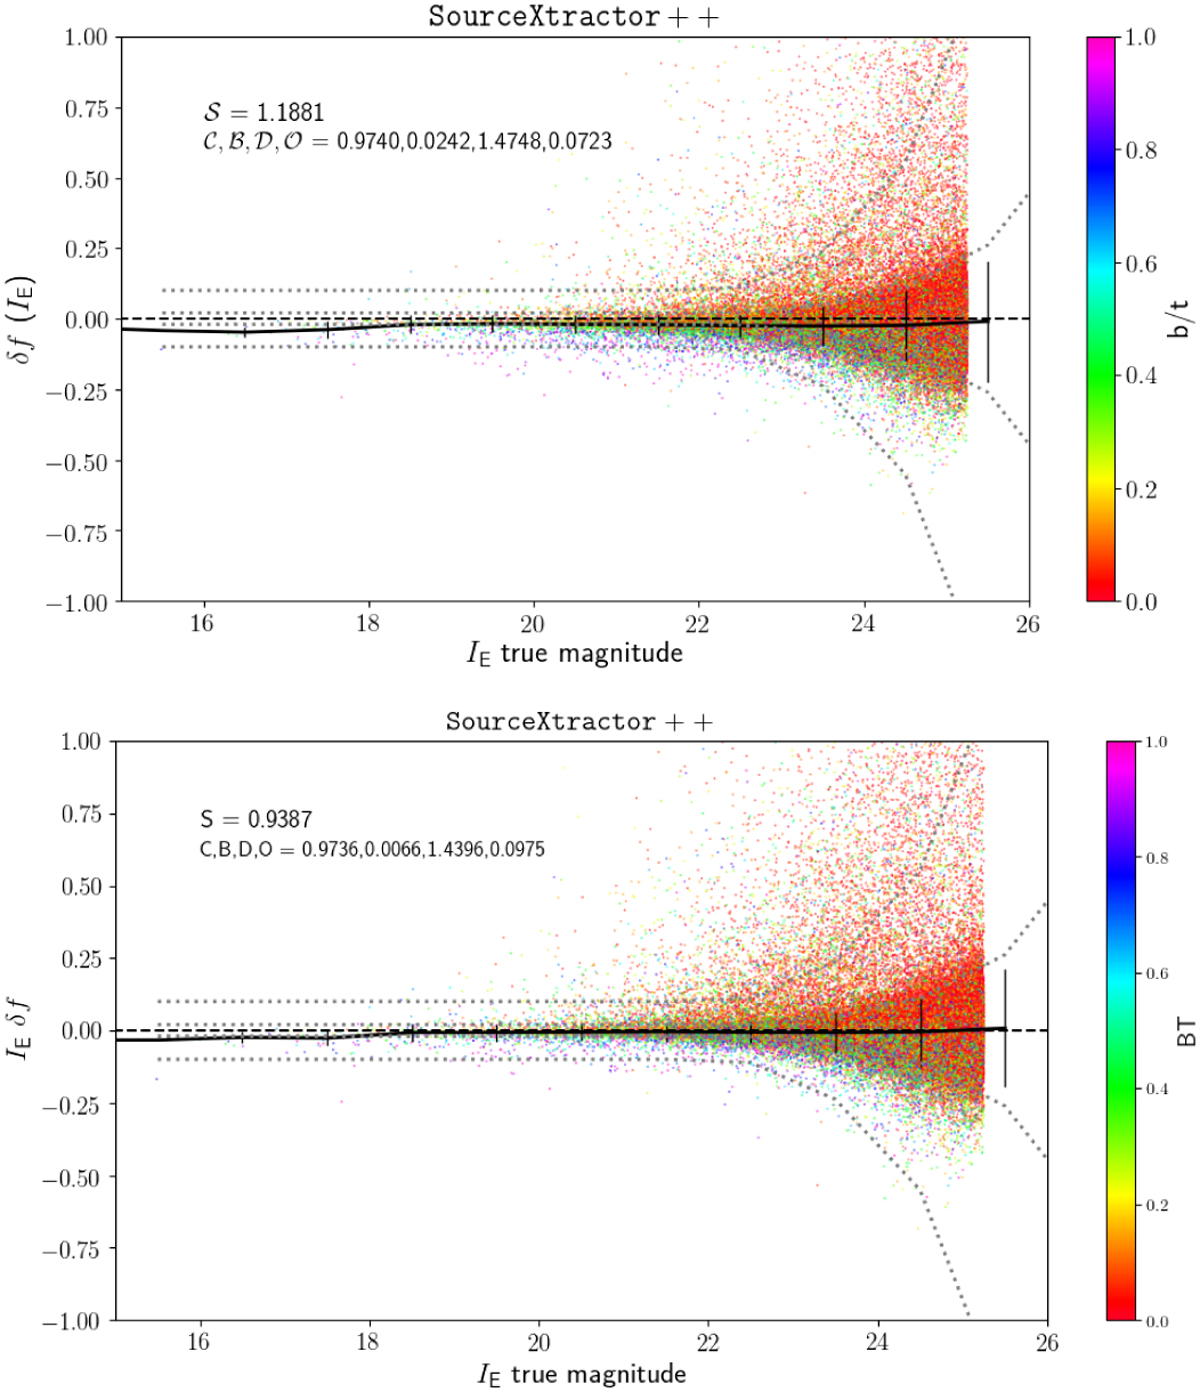
Example of diagnostic plot for SourceXtractor++. These plots refers to the IE DS F2 run; the upper panel shows the fit with nbulge = 4, while the bottom panel shows the one with nbulge left free to vary.
Current usage metrics show cumulative count of Article Views (full-text article views including HTML views, PDF and ePub downloads, according to the available data) and Abstracts Views on Vision4Press platform.
Data correspond to usage on the plateform after 2015. The current usage metrics is available 48-96 hours after online publication and is updated daily on week days.
Initial download of the metrics may take a while.