Open Access
Fig. B.8
Download original image
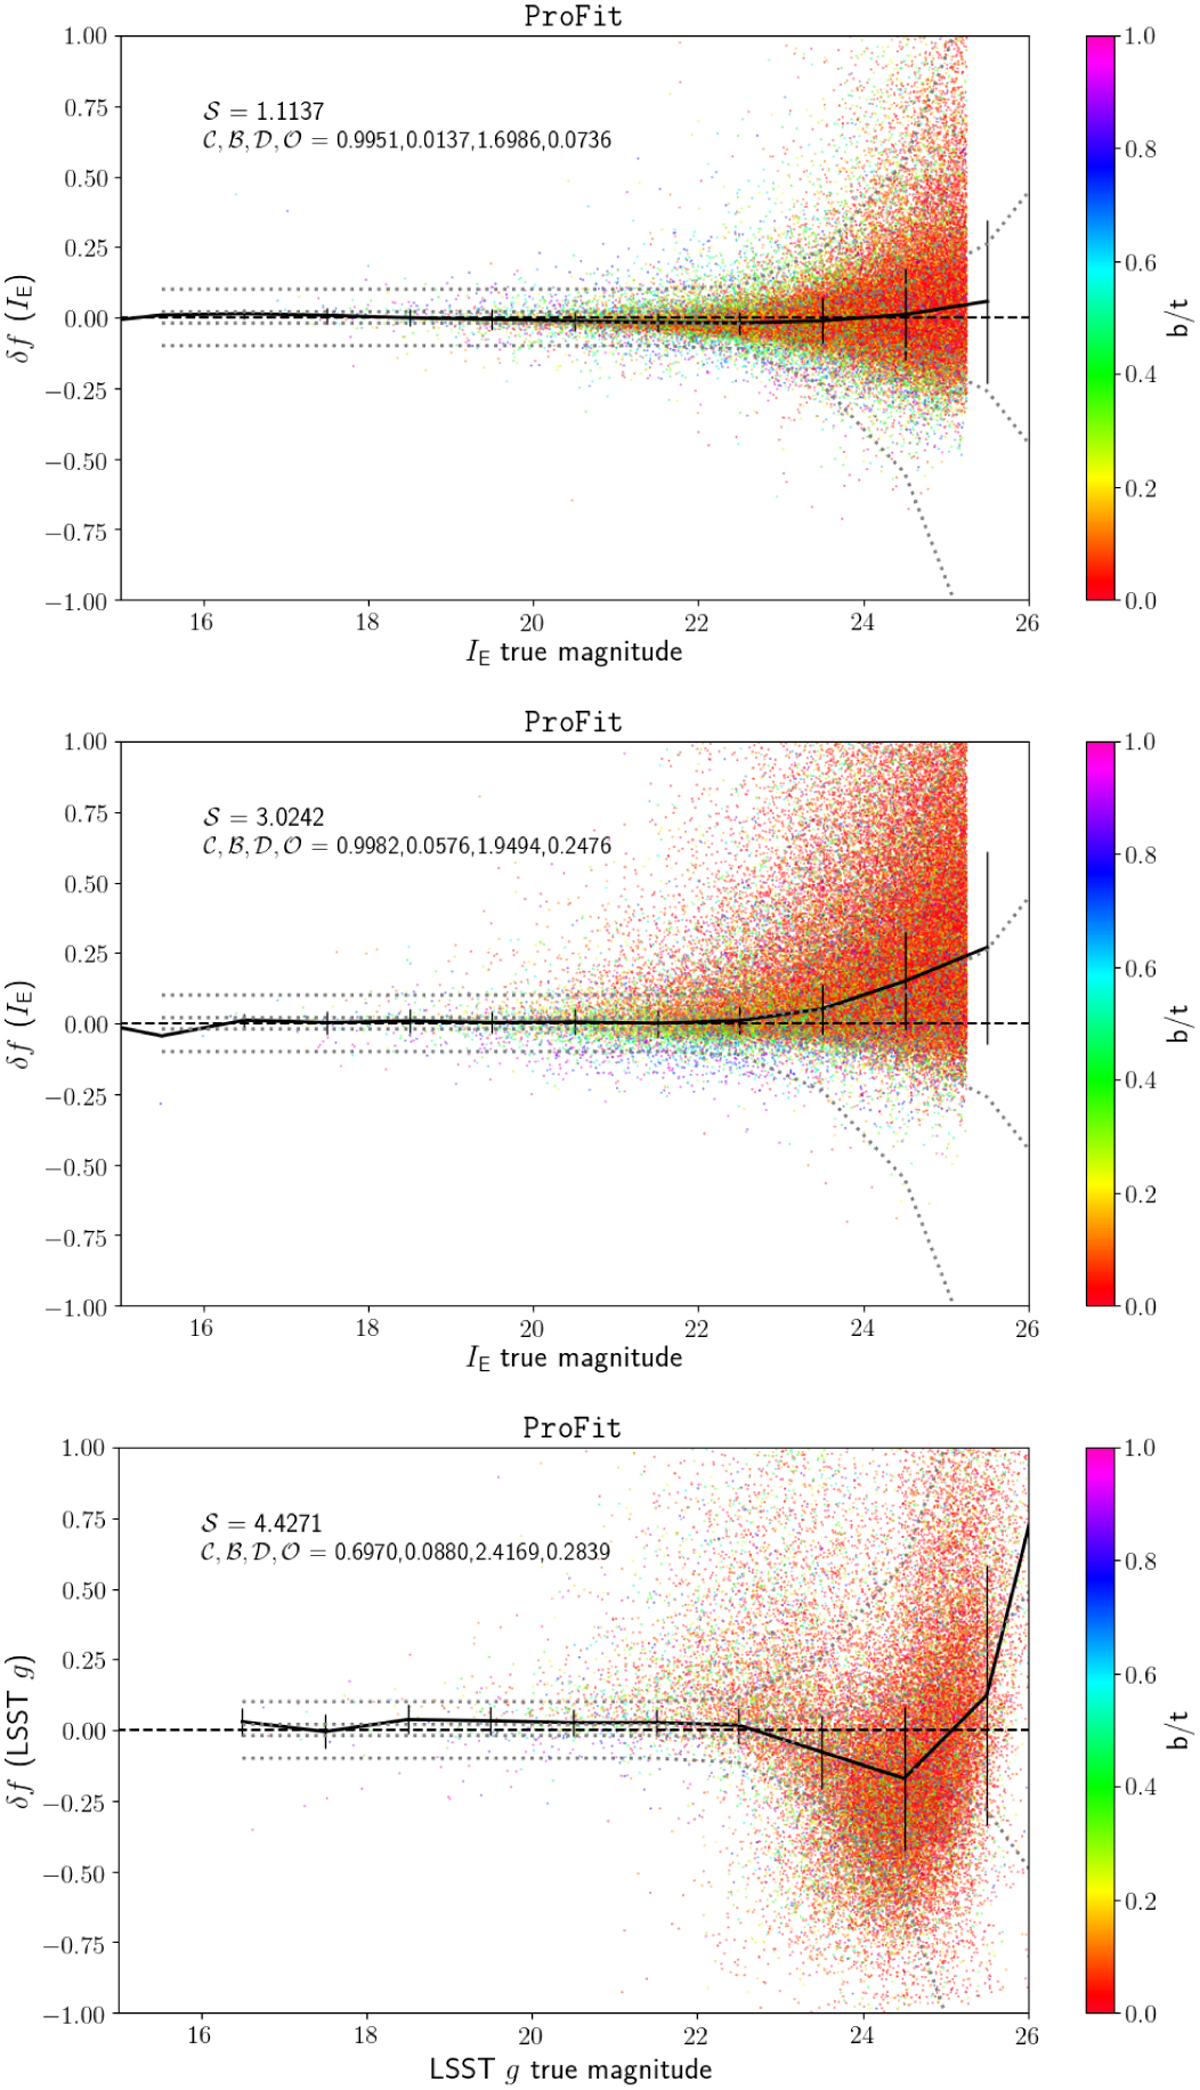
Example of diagnostic plot for ProFit. Top to bottom: IE SS F2; IE DS F2 (fixed bulge); and LSST g F0. The IE SS fit is substantially better than the DS fit, and there is a ‘U-shaped’ trend in the LSST bands.
Current usage metrics show cumulative count of Article Views (full-text article views including HTML views, PDF and ePub downloads, according to the available data) and Abstracts Views on Vision4Press platform.
Data correspond to usage on the plateform after 2015. The current usage metrics is available 48-96 hours after online publication and is updated daily on week days.
Initial download of the metrics may take a while.