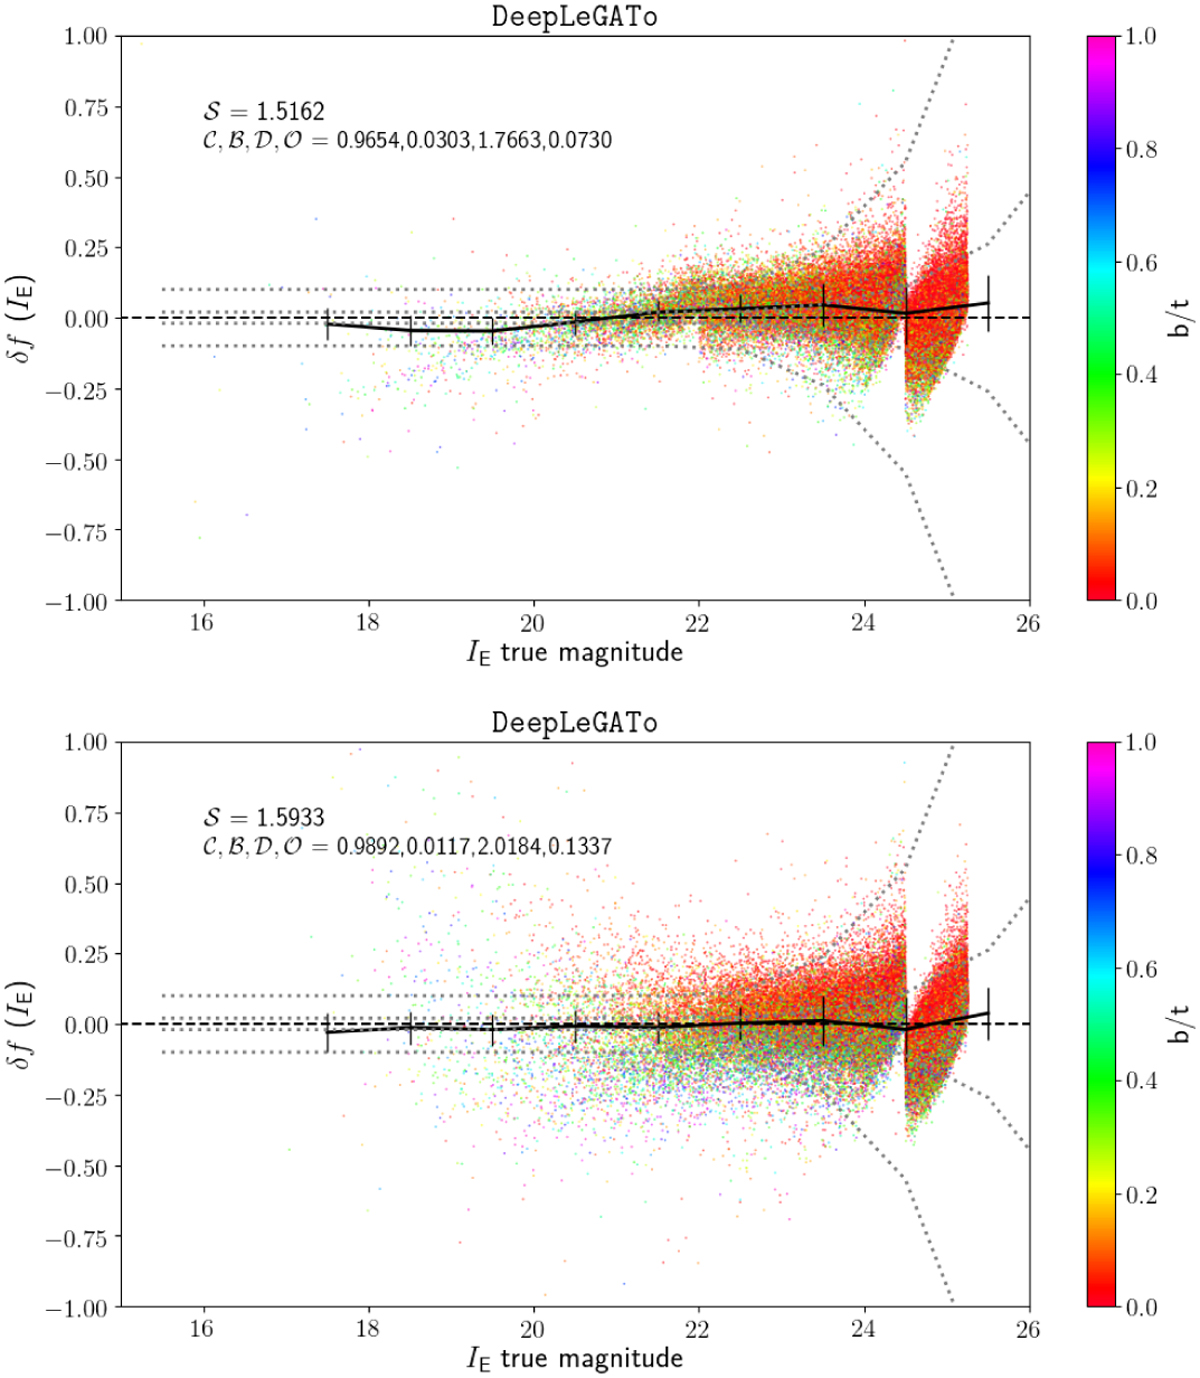
Fig. B.1
Download original image
Examples of diagnostic plots for DeepLeGATo. Top, IE SS F4 run; bottom, IE DS F4 run. See Fig. 8 for a description of this and the subsequent similar plots. We note that the colour coding is given by the value of the bulge fraction b/t in the original Egg double-Sérsic catalogue; it can be considered as a proxy for the value of the Sérsic index, n = 3 b/t + 1.
Current usage metrics show cumulative count of Article Views (full-text article views including HTML views, PDF and ePub downloads, according to the available data) and Abstracts Views on Vision4Press platform.
Data correspond to usage on the plateform after 2015. The current usage metrics is available 48-96 hours after online publication and is updated daily on week days.
Initial download of the metrics may take a while.