Fig. 19
Download original image
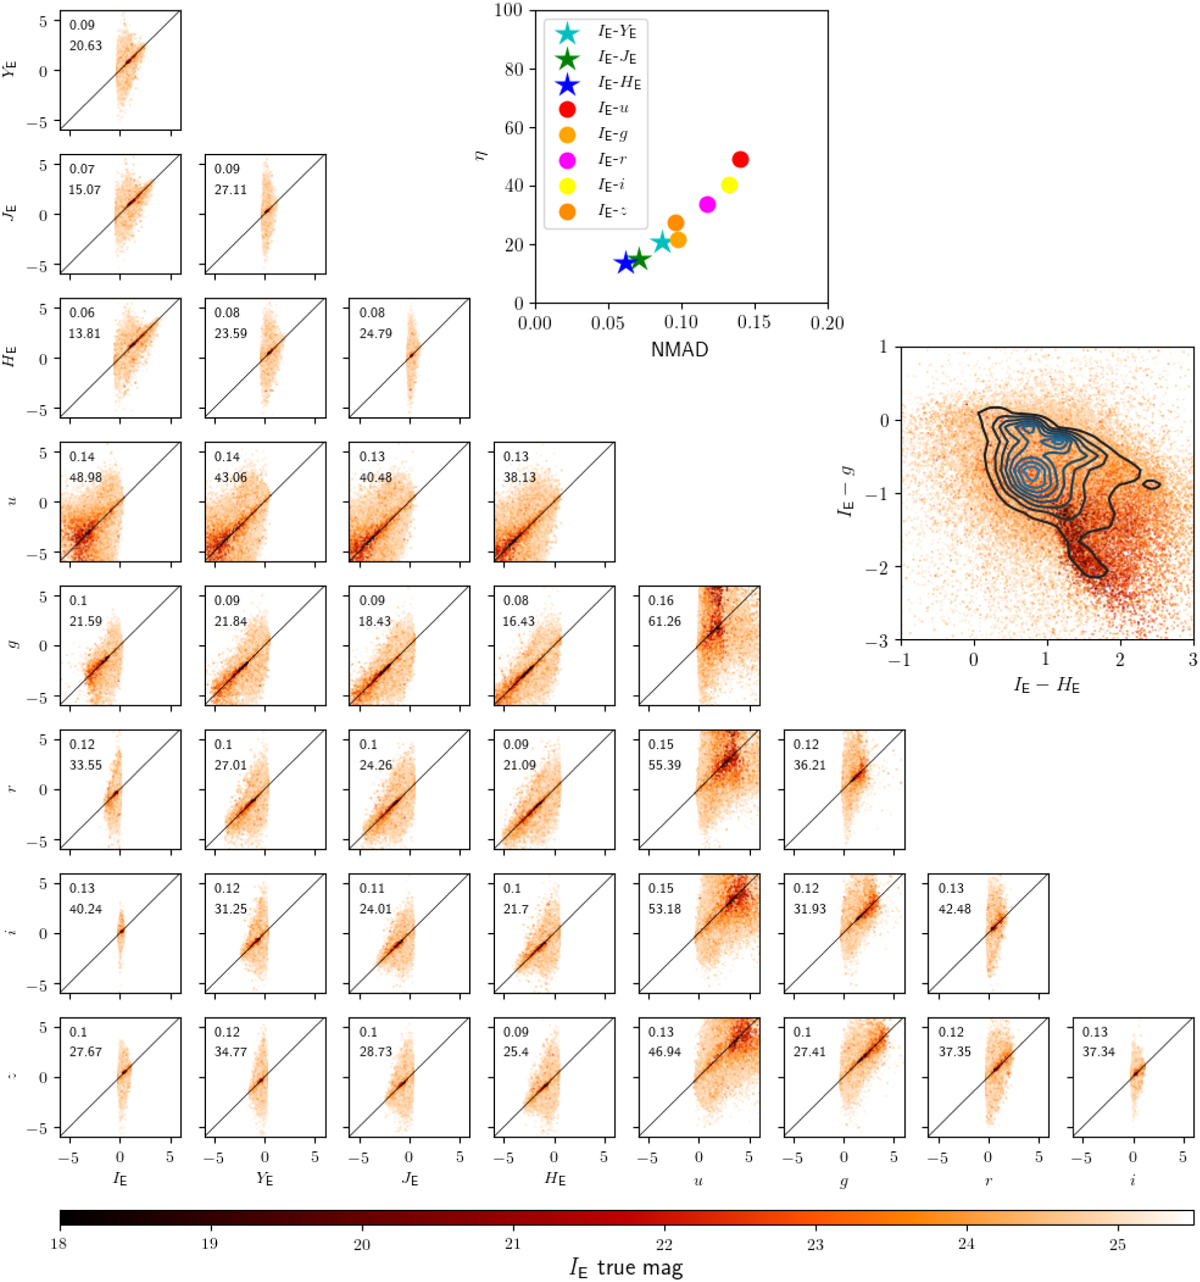
Colours estimates for Galapagos-2. Each small sub-panel on the left part of the plot shows the measured versus true colour (magnitude difference) for a pair of bands: the colour is always x-axis label – y-axis label. The numbers in each panel are the NMAD and η, as defined in the text. The upper larger panel shows the values of NMAD and η for the colours of all bands with respect to IE, as reported in the legend. The rightmost larger panel shows the IE − g versus IE − HE colour-colour diagram; points are the measured colours for individual galaxies, while the black lines are density contour levels of the corresponding true colours distribution.
Current usage metrics show cumulative count of Article Views (full-text article views including HTML views, PDF and ePub downloads, according to the available data) and Abstracts Views on Vision4Press platform.
Data correspond to usage on the plateform after 2015. The current usage metrics is available 48-96 hours after online publication and is updated daily on week days.
Initial download of the metrics may take a while.